


| Duration | 0:00 | Takeoff Distance | 0 |
| Height: | metres |
| Climb: | m/sec |
| Speed: | km/h |
| Distance: | km |
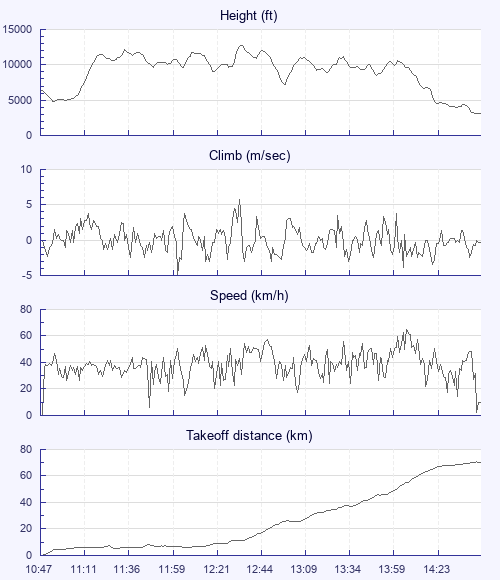
| Height - GPS data | |
| Maximum Height [12:34:16] |
12766 ft |
| Lowest Save [14:34:58] |
4003 ft |
| Takeoff Height [10:47:29] |
6319 ft |
| Landing Height [14:44:05] |
3061 ft |
| Total Ascent | 33648 ft |
| Height Gain | |
| Above Takeoff | 6447 ft |
| Maximum | 8012 ft |
| Low Point [10:54:26] |
4754 ft |
| High Point as Maximum Height |
12766 ft |
| Units | |
| Climb - Pressure data | |
| Maximum Climb [12:33:57] |
5.8 m/s |
| Minimum Climb [12:02:05] |
-5.0 m/s |
| Units | |
| Speed | |
| Maximum Speed [14:07:25] |
64.8 km/h |
| Average Speed around course |
21.7 km/h |
| Average Speed over track length |
38.8 km/h |
| Units | |
| Tracklog | |
| Flight Duration | 3hrs 56mins |
| Track Points | 14187 |
| Recording Interval | 1 secs |
| Statistics Interval | 4 secs |
| Track Length | 153.1 km |
| Units | |
| Flight instrument | |
| Type | Xc_tracer |
| Model | Not Set |
| Firmware | Xc_tracer_v1.0_r08 |
| Height: | |
| Speed: | |
| Climb: | |
| Distance: |
| Main Map: |
| First Tab: |