


| Duration | 0:00 | Takeoff Distance | 0 |
| Height: | metres |
| Climb: | m/sec |
| Speed: | km/h |
| Distance: | km |
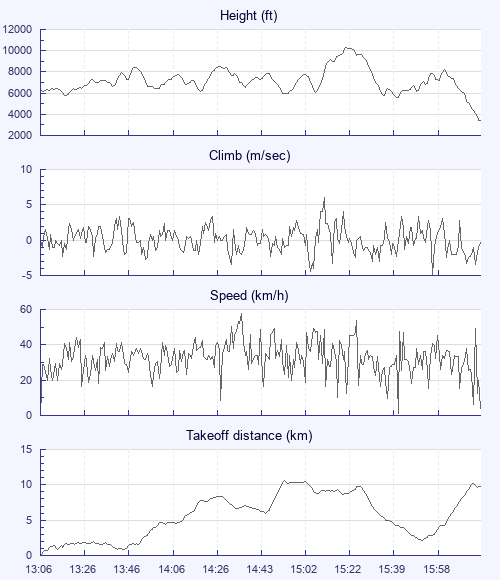
| Height - GPS data | |
| Maximum Height [15:24:03] |
10299 ft |
| Lowest Save [15:45:22] |
5551 ft |
| Takeoff Height [13:06:57] |
6309 ft |
| Landing Height [16:21:36] |
3396 ft |
| Total Ascent | 27198 ft |
| Height Gain | |
| Above Takeoff | 3990 ft |
| Maximum | 4573 ft |
| Low Point [13:19:01] |
5725 ft |
| High Point as Maximum Height |
10299 ft |
| Units | |
| Climb - Pressure data | |
| Maximum Climb [15:14:57] |
6.0 m/s |
| Minimum Climb [16:01:09] |
-4.8 m/s |
| Units | |
| Speed | |
| Maximum Speed [14:37:25] |
57.6 km/h |
| Average Speed around course |
20.1 km/h |
| Average Speed over track length |
33.3 km/h |
| Units | |
| Tracklog | |
| Flight Duration | 3hrs 14mins |
| Track Points | 11678 |
| Recording Interval | 1 secs |
| Statistics Interval | 4 secs |
| Track Length | 108.1 km |
| Units | |
| Flight instrument | |
| Type | Xc_tracer |
| Model | Not Set |
| Firmware | Xc_tracer_v1.0_r08 |
| Height: | |
| Speed: | |
| Climb: | |
| Distance: |
| Main Map: |
| First Tab: |