


| Duration | 0:00 | Takeoff Distance | 0 |
| Height: | metres |
| Climb: | m/sec |
| Speed: | km/h |
| Distance: | km |
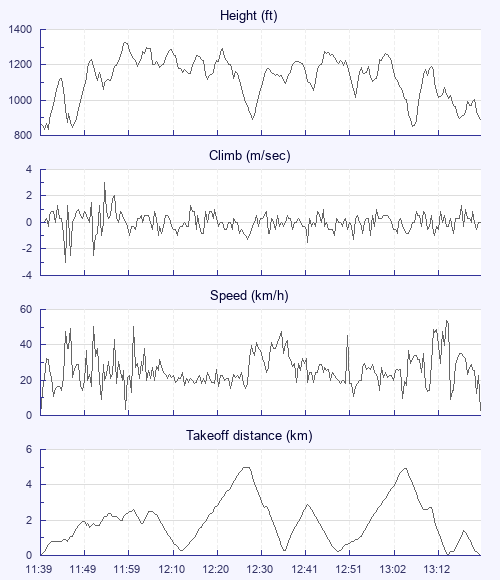
| Height - GPS data | |
| Maximum Height [11:59:20] |
1329 ft |
| Takeoff Height [11:39:13] |
866 ft |
| Landing Height [13:23:05] |
892 ft |
| Total Ascent | 6578 ft |
| Height Gain | |
| Above Takeoff | 463 ft |
| Maximum | 505 ft |
| Low Point [11:41:11] |
823 ft |
| High Point as Maximum Height |
1329 ft |
| Units | |
| Climb - GPS data | |
| Maximum Climb [11:54:57] |
3.0 m/s |
| Minimum Climb [11:45:17] |
-3.0 m/s |
| Units | |
| Speed | |
| Maximum Speed [13:15:13] |
54.0 km/h |
| Average Speed around course |
24.2 km/h |
| Average Speed over track length |
26.1 km/h |
| Units | |
| Tracklog | |
| Flight Duration | 1hr 43mins |
| Track Points | 6233 |
| Recording Interval | 1 secs |
| Statistics Interval | 4 secs |
| Track Length | 45.2 km |
| Units | |
| Flight instrument | |
| Type | Naviter |
| Model | Seeyou Navigator |
| Firmware | 2.14.1+2010 |
| Height: | |
| Speed: | |
| Climb: | |
| Distance: |
| Main Map: |
| First Tab: |