


| Duration | 0:00 | Takeoff Distance | 0 |
| Height: | metres |
| Climb: | m/sec |
| Speed: | km/h |
| Distance: | km |
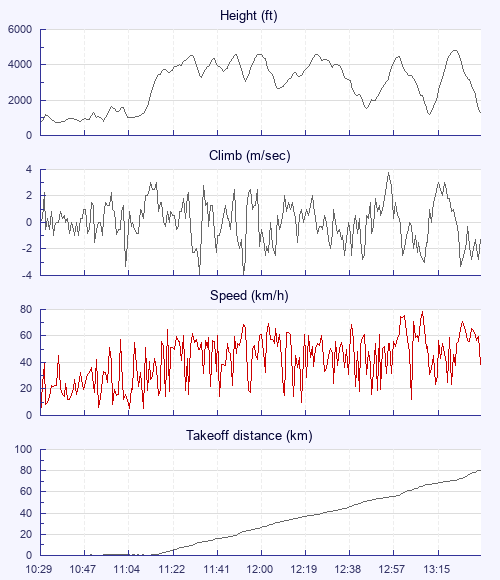
| Height - GPS data | |
| Maximum Height [13:25:52] |
4829 ft |
| Lowest Save [11:04:55] |
1010 ft |
| Takeoff Height [10:29:02] |
741 ft |
| Landing Height [13:36:08] |
1309 ft |
| Total Ascent | 23789 ft |
| Height Gain | |
| Above Takeoff | 4088 ft |
| Maximum | 4121 ft |
| Low Point [10:36:38] |
709 ft |
| High Point as Maximum Height |
4829 ft |
| Units | |
| Climb - Pressure data | |
| Maximum Climb [12:57:14] |
3.8 m/s |
| Minimum Climb [11:35:02] |
-4.0 m/s |
| Units | |
| Speed | |
| Maximum Speed [13:11:37] |
78.3 km/h |
| Average Speed around course |
27.9 km/h |
| Average Speed over track length |
41.8 km/h |
| Units | |
| Tracklog | |
| Flight Duration | 3hrs 7mins |
| Track Points | 11227 |
| Recording Interval | 1 secs |
| Statistics Interval | 4 secs |
| Track Length | 130.2 km |
| Invalid Positions [< 1%] |
8 |
| Units | |
| Flight instrument | |
| Type | Samsung Sm-a526b 14 |
| Model | Not Set |
| Firmware | 0.9.10.6 |
| Height: | |
| Speed: | |
| Climb: | |
| Distance: |
| Main Map: |
| First Tab: |