In stunning skies climbed out with Craig Atwell - last spotted drifting North with dolphins.
Clean landing followed by three quick hitches and back home comfortably in time to cut the grass.
Today's lesson - Make sure my SD card is in the gopro!


| Duration | 0:00 | Takeoff Distance | 0 |
| Height: | metres |
| Climb: | m/sec |
| Speed: | km/h |
| Distance: | km |
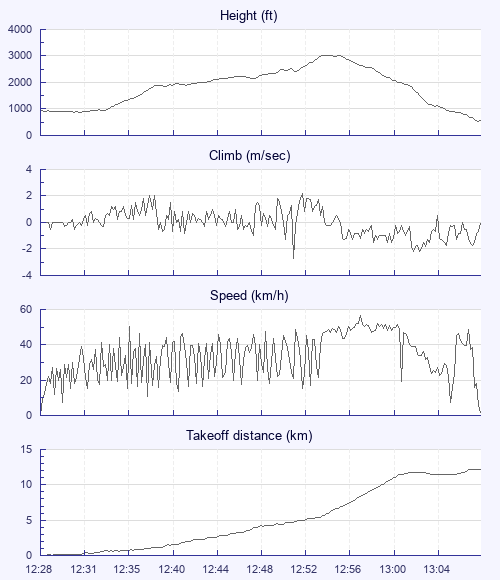
| Height - GPS data | |
| Maximum Height [12:55:07] |
3025 ft |
| Takeoff Height [12:28:11] |
935 ft |
| Landing Height [13:09:38] |
551 ft |
| Total Ascent | 3301 ft |
| Height Gain | |
| Above Takeoff | 2090 ft |
| Maximum | 2146 ft |
| Low Point [12:31:25] |
879 ft |
| High Point as Maximum Height |
3025 ft |
| Units | |
| Climb - Pressure data | |
| Maximum Climb [12:53:13] |
2.2 m/s |
| Minimum Climb [12:52:31] |
-2.7 m/s |
| Units | |
| Speed | |
| Maximum Speed [12:58:55] |
56.4 km/h |
| Average Speed around course |
23.9 km/h |
| Average Speed over track length |
34.2 km/h |
| Units | |
| Tracklog | |
| Flight Duration | 41mins |
| Track Points | 840 |
| Recording Interval | 3 secs |
| Statistics Interval | 6 secs |
| Track Length | 23.6 km |
| Units | |
| Flight instrument | |
| Type | Oudie 4 Basic |
| Model | R |
| Firmware | 9.37.001 |
In stunning skies climbed out with Craig Atwell - last spotted drifting North with dolphins.
Clean landing followed by three quick hitches and back home comfortably in time to cut the grass.
Today's lesson - Make sure my SD card is in the gopro!
| Height: | |
| Speed: | |
| Climb: | |
| Distance: |
| Main Map: |
| First Tab: |