


| Duration | 0:00 | Takeoff Distance | 0 |
| Height: | metres |
| Climb: | m/sec |
| Speed: | km/h |
| Distance: | km |
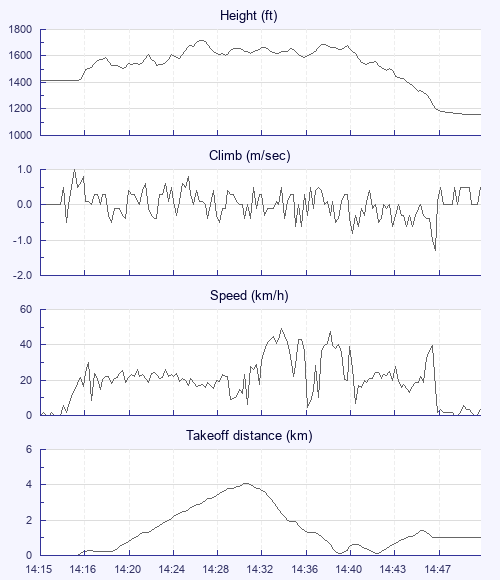
| Height - GPS data | |
| Maximum Height [14:27:29] |
1719 ft |
| Takeoff Height [14:15:31] |
1417 ft |
| Landing Height [14:49:38] |
1161 ft |
| Total Ascent | 1047 ft |
| Height Gain | |
| Above Takeoff | 302 ft |
| Maximum | 305 ft |
| Low Point [14:15:34] |
1414 ft |
| High Point as Maximum Height |
1719 ft |
| Units | |
| Climb - Pressure data | |
| Maximum Climb [14:16:19] |
1.0 m/s |
| Minimum Climb [14:48:35] |
-1.3 m/s |
| Units | |
| Speed | |
| Maximum Speed [14:34:57] |
49.5 km/h |
| Average Speed around course |
22.0 km/h |
| Average Speed over track length |
22.9 km/h |
| Units | |
| Tracklog | |
| Flight Duration | 34mins |
| Track Points | 599 |
| Recording Interval | 3 secs |
| Statistics Interval | 6 secs |
| Track Length | 13.0 km |
| Units | |
| Flight instrument | |
| Type | Oudie 4 Full |
| Model | Y |
| Firmware | 9.39.001 |
| Height: | |
| Speed: | |
| Climb: | |
| Distance: |
| Main Map: |
| First Tab: |