


| Duration | 0:00 | Takeoff Distance | 0 |
| Height: | metres |
| Climb: | m/sec |
| Speed: | km/h |
| Distance: | km |
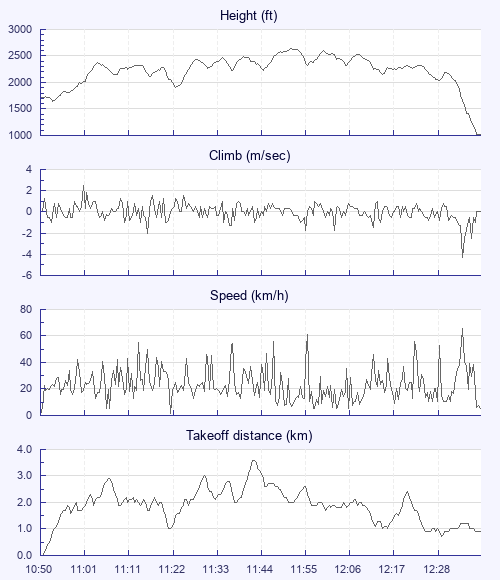
| Height - GPS data | |
| Maximum Height [11:54:06] |
2635 ft |
| Takeoff Height [10:50:47] |
1706 ft |
| Landing Height [12:41:43] |
1010 ft |
| Total Ascent | 6181 ft |
| Height Gain | |
| Above Takeoff | 928 ft |
| Maximum | 1007 ft |
| Low Point [10:54:08] |
1627 ft |
| High Point as Maximum Height |
2635 ft |
| Units | |
| Climb - Pressure data | |
| Maximum Climb [11:01:51] |
2.5 m/s |
| Minimum Climb [12:37:55] |
-4.3 m/s |
| Units | |
| Speed | |
| Maximum Speed [12:37:55] |
65.7 km/h |
| Average Speed around course |
6.8 km/h |
| Average Speed over track length |
23.0 km/h |
| Units | |
| Tracklog | |
| Flight Duration | 1hr 50mins |
| Track Points | 6657 |
| Recording Interval | 1 secs |
| Statistics Interval | 4 secs |
| Track Length | 42.5 km |
| Units | |
| Flight instrument | |
| Type | Xc_mini_iv_gps |
| Model | Not Set |
| Firmware | Xc_tracer_mini_v_r02 |
| Height: | |
| Speed: | |
| Climb: | |
| Distance: |
| Main Map: |
| First Tab: |