


| Duration | 0:00 | Takeoff Distance | 0 |
| Height: | metres |
| Climb: | m/sec |
| Speed: | km/h |
| Distance: | km |
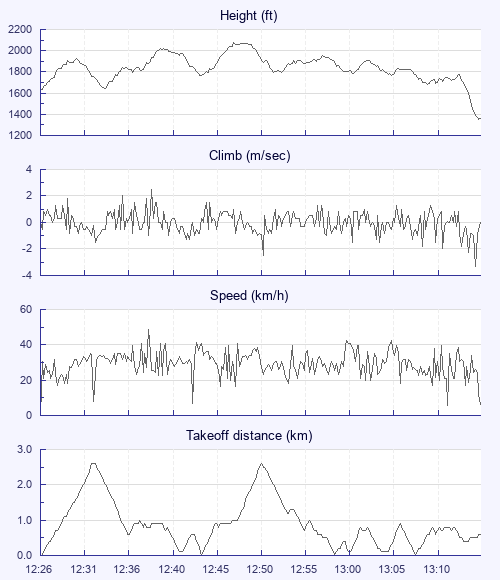
| Height - GPS data | |
| Maximum Height [12:47:56] |
2073 ft |
| Takeoff Height [12:26:29] |
1640 ft |
| Landing Height [13:15:44] |
1358 ft |
| Total Ascent | 3114 ft |
| Height Gain | |
| Above Takeoff | 433 ft |
| Maximum | 443 ft |
| Low Point [12:26:34] |
1631 ft |
| High Point as Maximum Height |
2073 ft |
| Units | |
| Climb - Pressure data | |
| Maximum Climb [12:38:44] |
2.5 m/s |
| Minimum Climb [13:15:20] |
-3.3 m/s |
| Units | |
| Speed | |
| Maximum Speed [12:38:32] |
48.6 km/h |
| Average Speed around course |
16.1 km/h |
| Average Speed over track length |
29.7 km/h |
| Units | |
| Tracklog | |
| Flight Duration | 49mins |
| Track Points | 1481 |
| Recording Interval | 2 secs |
| Statistics Interval | 4 secs |
| Track Length | 24.4 km |
| Units | |
| Flight instrument | |
| Type | Flymaster |
| Model | Livesdii |
| Firmware | 2.03j |
| Height: | |
| Speed: | |
| Climb: | |
| Distance: |
| Main Map: |
| First Tab: |