


| Duration | 0:00 | Takeoff Distance | 0 |
| Height: | metres |
| Climb: | m/sec |
| Speed: | km/h |
| Distance: | km |
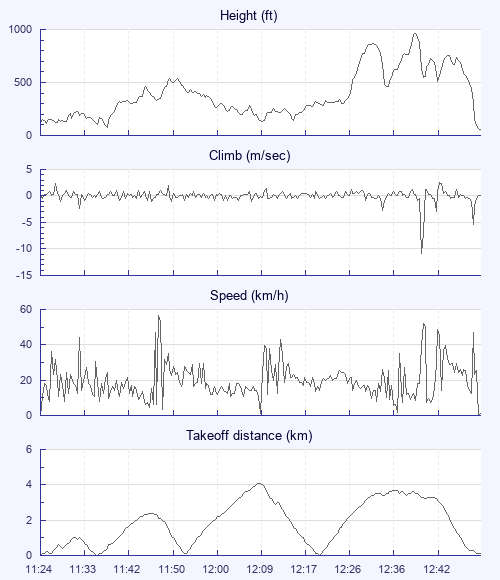
| Height - GPS data | |
| Maximum Height [12:41:55] |
965 ft |
| Lowest Save [12:37:10] |
459 ft |
| Takeoff Height [11:24:08] |
125 ft |
| Landing Height [12:54:44] |
59 ft |
| Total Ascent | 5988 ft |
| Height Gain | |
| Above Takeoff | 840 ft |
| Maximum | 899 ft |
| Low Point [11:38:14] |
66 ft |
| High Point as Maximum Height |
965 ft |
| Units | |
| Climb - GPS data | |
| Maximum Climb [12:46:20] |
2.5 m/s |
| Minimum Climb [12:42:52] |
-10.8 m/s |
| Units | |
| Speed | |
| Maximum Speed [11:49:16] |
56.7 km/h |
| Average Speed around course |
16.3 km/h |
| Average Speed over track length |
19.2 km/h |
| Units | |
| Tracklog | |
| Flight Duration | 1hr 30mins |
| Track Points | 5437 |
| Recording Interval | 1 secs |
| Statistics Interval | 4 secs |
| Track Length | 29.0 km |
| Units | |
| Flight instrument | |
| Type | Naviter |
| Model | Oudie N |
| Firmware | 2.8.1+1647 |
| Height: | |
| Speed: | |
| Climb: | |
| Distance: |
| Main Map: |
| First Tab: |