


| Duration | 0:00 | Takeoff Distance | 0 |
| Height: | metres |
| Climb: | m/sec |
| Speed: | km/h |
| Distance: | km |
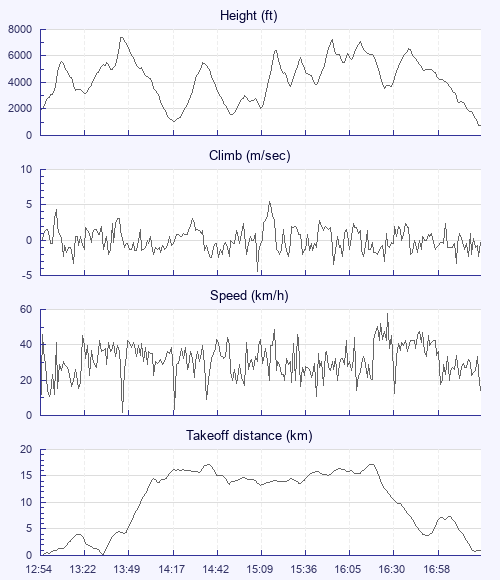
| Height - GPS data | |
| Maximum Height [13:45:56] |
7411 ft |
| Lowest Save [14:18:52] |
1060 ft |
| Takeoff Height [12:54:53] |
1896 ft |
| Landing Height [17:24:45] |
764 ft |
| Total Ascent | 35640 ft |
| Height Gain | |
| Above Takeoff | 5515 ft |
| Maximum | 6184 ft |
| Low Point as Lowest Save |
1060 ft |
| High Point [15:56:08] |
7244 ft |
| Units | |
| Climb - Pressure data | |
| Maximum Climb [15:16:21] |
5.5 m/s |
| Minimum Climb [15:09:33] |
-4.5 m/s |
| Units | |
| Speed | |
| Maximum Speed [16:29:53] |
57.6 km/h |
| Average Speed around course |
16.9 km/h |
| Average Speed over track length |
31.7 km/h |
| Units | |
| Tracklog | |
| Flight Duration | 4hrs 29mins |
| Track Points | 16193 |
| Recording Interval | 1 secs |
| Statistics Interval | 4 secs |
| Track Length | 142.8 km |
| Units | |
| Flight instrument | |
| Type | Flymaster |
| Model | Livesdii |
| Firmware | 2.03e |
| Height: | |
| Speed: | |
| Climb: | |
| Distance: |
| Main Map: |
| First Tab: |