


| Duration | 0:00 | Takeoff Distance | 0 |
| Height: | metres |
| Climb: | m/sec |
| Speed: | km/h |
| Distance: | km |
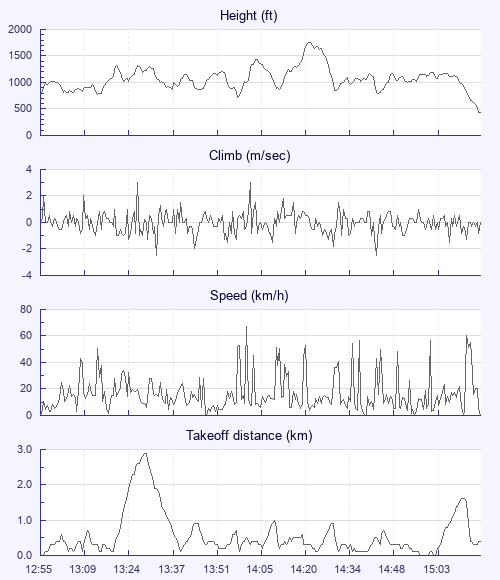
| Height - GPS data | |
| Maximum Height [14:23:11] |
1755 ft |
| Lowest Save [14:46:23] |
787 ft |
| Takeoff Height [12:55:12] |
764 ft |
| Landing Height [15:19:25] |
443 ft |
| Total Ascent | 8012 ft |
| Height Gain | |
| Above Takeoff | 991 ft |
| Maximum | 1037 ft |
| Low Point [13:59:30] |
719 ft |
| High Point as Maximum Height |
1755 ft |
| Units | |
| Climb - GPS data | |
| Maximum Climb [13:27:16] |
3.0 m/s |
| Minimum Climb [13:32:40] |
-2.5 m/s |
| Units | |
| Speed | |
| Maximum Speed [14:02:09] |
67.5 km/h |
| Average Speed around course |
3.3 km/h |
| Average Speed over track length |
15.7 km/h |
| Units | |
| Tracklog | |
| Flight Duration | 2hrs 24mins |
| Track Points | 8653 |
| Recording Interval | 1 secs |
| Statistics Interval | 4 secs |
| Track Length | 37.8 km |
| Units | |
| Flight instrument | |
| Type | Xiaomi M2006c3lg 10 |
| Model | Not Set |
| Firmware | 0.9.8.4 |
| Height: | |
| Speed: | |
| Climb: | |
| Distance: |
| Main Map: |
| First Tab: |