


| Duration | 0:00 | Takeoff Distance | 0 |
| Height: | metres |
| Climb: | m/sec |
| Speed: | km/h |
| Distance: | km |
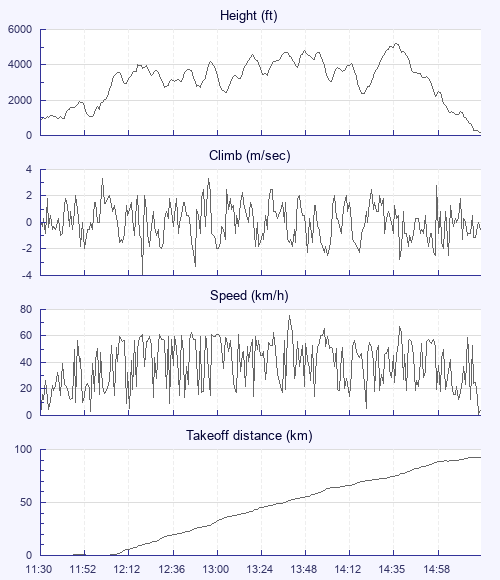
| Height - GPS data | |
| Maximum Height [14:39:02] |
5184 ft |
| Lowest Save [11:55:13] |
1089 ft |
| Takeoff Height [11:30:50] |
860 ft |
| Landing Height [15:21:43] |
177 ft |
| Total Ascent | 26450 ft |
| Height Gain | |
| Above Takeoff | 4324 ft |
| Units | |
| Climb - Pressure data | |
| Maximum Climb [12:00:54] |
3.3 m/s |
| Minimum Climb [12:20:46] |
-4.0 m/s |
| Units | |
| Speed | |
| Maximum Speed [13:41:22] |
75.6 km/h |
| Average Speed around course |
25.5 km/h |
| Average Speed over track length |
39.3 km/h |
| Units | |
| Tracklog | |
| Flight Duration | 3hrs 50mins |
| Track Points | 13854 |
| Recording Interval | 1 secs |
| Statistics Interval | 4 secs |
| Track Length | 151.1 km |
| Units | |
| Flight instrument | |
| Type | Oudie 5 Pro |
| Model | R |
| Firmware | 9.36.001 |
| Height: | |
| Speed: | |
| Climb: | |
| Distance: |
| Main Map: |
| First Tab: |