


| Duration | 0:00 | Takeoff Distance | 0 |
| Height: | metres |
| Climb: | m/sec |
| Speed: | km/h |
| Distance: | km |
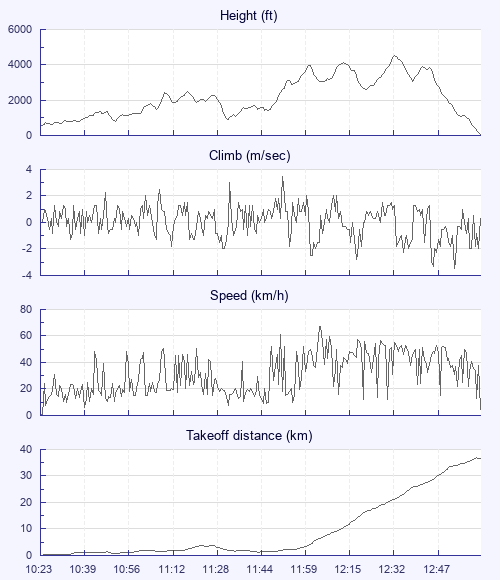
| Height - GPS data | |
| Maximum Height [12:33:25] |
4544 ft |
| Lowest Save [11:33:18] |
925 ft |
| Takeoff Height [10:23:37] |
548 ft |
| Landing Height [13:03:37] |
66 ft |
| Total Ascent | 15906 ft |
| Height Gain | |
| Above Takeoff | 3996 ft |
| Units | |
| Climb - Pressure data | |
| Maximum Climb [11:52:05] |
3.5 m/s |
| Minimum Climb [12:54:49] |
-3.5 m/s |
| Units | |
| Speed | |
| Maximum Speed [12:05:33] |
67.5 km/h |
| Average Speed around course |
16.6 km/h |
| Average Speed over track length |
30.9 km/h |
| Units | |
| Tracklog | |
| Flight Duration | 2hrs 40mins |
| Track Points | 9601 |
| Recording Interval | 1 secs |
| Statistics Interval | 4 secs |
| Track Length | 82.4 km |
| Units | |
| Flight instrument | |
| Type | Xc_tracer_ii_flarm |
| Model | Not Set |
| Firmware | Xc_tracer_ii_flarm_r06 |
| Height: | |
| Speed: | |
| Climb: | |
| Distance: |
| Main Map: |
| First Tab: |