


| Duration | 0:00 | Takeoff Distance | 0 |
| Height: | metres |
| Climb: | m/sec |
| Speed: | km/h |
| Distance: | km |
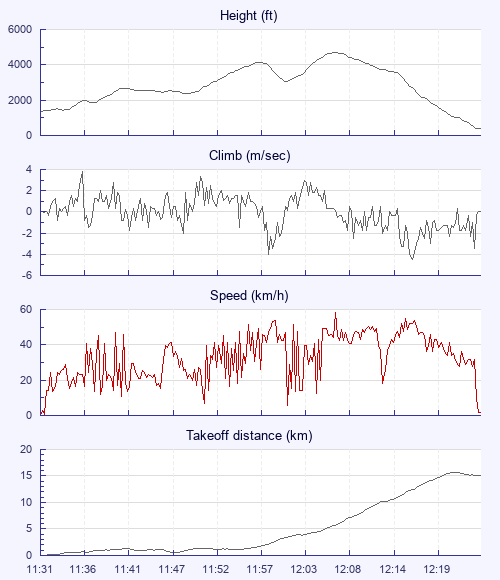
| Height - GPS data | |
| Maximum Height [12:07:06] |
4692 ft |
| Lowest Save [12:01:15] |
3054 ft |
| Takeoff Height [11:31:21] |
1375 ft |
| Landing Height [12:24:35] |
410 ft |
| Total Ascent | 5869 ft |
| Height Gain | |
| Above Takeoff | 3317 ft |
| Units | |
| Climb - Pressure data | |
| Maximum Climb [11:36:17] |
3.8 m/s |
| Minimum Climb [12:16:51] |
-4.5 m/s |
| Units | |
| Speed | |
| Maximum Speed [12:07:07] |
58.1 km/h |
| Average Speed around course |
24.1 km/h |
| Average Speed over track length |
33.7 km/h |
| Units | |
| Tracklog | |
| Flight Duration | 53mins |
| Track Points | 3195 |
| Recording Interval | 1 secs |
| Statistics Interval | 4 secs |
| Track Length | 29.9 km |
| Invalid Positions [< 1%] |
2 |
| Units | |
| Flight instrument | |
| Type | Huawei Vog-l29 10 |
| Model | Not Set |
| Firmware | 0.9.7.0-beta |
| Height: | |
| Speed: | |
| Climb: | |
| Distance: |
| Main Map: |
| First Tab: |