Xc Title
User:Guest
Ozone advert
Richard Meek  All flights
Overseas League 2022
Flight type image
FAI Triangle on a Paraglider
Club
Dales
Glider
Ozone Alpina 2
Date
15th October 2022
Start
10:29
Finish
16:35
Duration
6hrs 6mins
Takeoff
Bir Billing TO
Coords
Takeoff
32.05970, 76.74450
Start
32.05695, 76.74388
TP1
32.19952, 76.99853
TP2
32.17292, 76.60627
TP3
31.92807, 76.89377
Finish
32.05655, 76.74277
Landing
32.04202, 76.70912
Distances and Score
Leg 1
31.69k
Leg 2
37.11k
Leg 3
38.40k
Distance
107.20k
Deductions
0.11k  (circuit gap 114m)
Total
107.09k
Multiplier
x 1.50
Score
160.6
Open Distance
Total
38.4k
Filename
Use full pilot name
Download
Validated
No
Flight map
Notes

This map gives an overview of the flight, using the turnpoints to plot the track.

Use the for a detailed map and flight track.

Duration 0:00   Takeoff Distance 0
Controls
To animate the flight: click a point on the track, use the slider, or click the Play button.
slider
slider
Speed
Speed
Slower
Faster
Track color
No data
Highlights
Track data
Time: No data
Height:
Climb:
Speed:
Interval:
Units
Height: metres
Climb: m/sec
Speed: km/h
Distance: km
chart
Notes

Climb and Speed averaged over 4 second intervals.

These values may be lower than those shown by a flight instrument, which has access to continuous raw data.

Red values indicate suspect data, because the tracklog contains invalid points.

Metric units are used for all chart data, except for Height which is shown in feet.

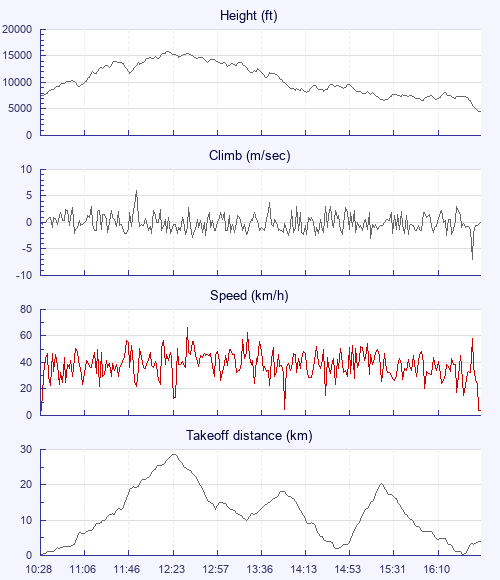
Height   -   Pressure data
Maximum Height
[12:21:04]
15837 ft
Lowest Save
[15:59:16]
6617 ft
Takeoff Height
[10:28:16]
7664 ft
Landing Height
[16:47:31]
4465 ft
Total Ascent 46549 ft
Height Gain
Above Takeoff 8173 ft
Maximum 8291 ft
Low Point
[10:29:32]
7546 ft
High Point
as Maximum Height
15837 ft
Units
Climb   -   Pressure data
Maximum Climb
[11:53:00]
6.0 m/s
Minimum Climb
[16:41:59]
-6.9 m/s
Units
Speed
Maximum Speed
[12:33:56]
66.6 km/h
Average Speed
around course
17.5 km/h
Average Speed
over track length
38.4 km/h
Units
Tracklog
Flight Duration 6hrs 19mins
Track Points 22756
Recording Interval 1 secs
Statistics Interval 4 secs
Track Length 242.6 km
Invalid Positions
[< 1%]
11
Units
Flight instrument
Type Xiaomi Mi Max 3 10
Model Not Set
Firmware 0.9.8-beta
Notes

Climb and Speed averaged over 4 second intervals.

These values may be lower than those shown by a flight instrument, which has access to continuous raw data.

Red values indicate suspect data, because the tracklog contains invalid points.

Average Speed around course is measured from Start to Finish points.

Track Length is the cumulative distance between track points from Takeoff to Landing.

You can change the default units displayed - see the Options page.

Use this page to set various display Options. You can choose which units are used to display flight data, which map to show when the starts and which tab to show each time you view a flight.
Units settings

Metric units are used by default for the Statistics and XC Player pages, except for Height data which is shown in feet. You can choose your own custom settings here.

Height:
Speed:
Climb:
Distance:
  Use default
XC Player settings

When the XC Player starts, the track data is shown on the Hybrid map. You can choose a different map here.

Main Map:
  Use default
Tab settings

The first tab shown when you view a flight is the Flight Map. You can choose a different tab here.

First Tab:
  Use default
Notes

This page uses cookies to save your settings for future visits.

If you have disabled cookies for this site then any changes you make will not be saved.