


| Duration | 0:00 | Takeoff Distance | 0 |
| Height: | metres |
| Climb: | m/sec |
| Speed: | km/h |
| Distance: | km |
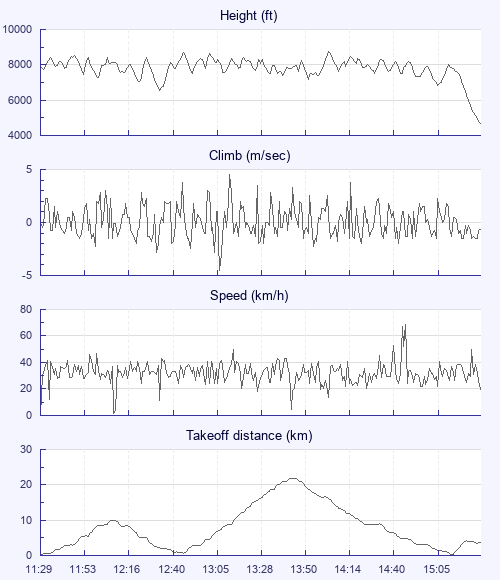
| Height - GPS data | |
| Maximum Height [14:09:03] |
8773 ft |
| Lowest Save [12:35:53] |
6572 ft |
| Takeoff Height [11:29:35] |
7887 ft |
| Landing Height [15:37:24] |
4672 ft |
| Total Ascent | 31818 ft |
| Height Gain | |
| Above Takeoff | 886 ft |
| Maximum | 2201 ft |
| Low Point as Lowest Save |
6572 ft |
| High Point as Maximum Height |
8773 ft |
| Units | |
| Climb - Pressure data | |
| Maximum Climb [13:14:59] |
4.5 m/s |
| Minimum Climb [13:10:19] |
-4.5 m/s |
| Units | |
| Speed | |
| Maximum Speed [14:54:26] |
68.4 km/h |
| Average Speed around course |
16.9 km/h |
| Average Speed over track length |
32.0 km/h |
| Units | |
| Tracklog | |
| Flight Duration | 4hrs 7mins |
| Track Points | 14752 |
| Recording Interval | 1 secs |
| Statistics Interval | 4 secs |
| Track Length | 132.2 km |
| Units | |
| Flight instrument | |
| Type | Xc_tracer_mini_ii_gps |
| Model | Not Set |
| Firmware | Xc_tracer_mini_ii_gp |
| Height: | |
| Speed: | |
| Climb: | |
| Distance: |
| Main Map: |
| First Tab: |