Xc Title
User:Guest
Naviter advert
Marshall Hall  All flights
Overseas League 2022
Flight type image
Declared Out and Return on a Paraglider
Club
Dunstable
Glider
Date
23rd October 2022
Start
10:08
Finish
14:15
Duration
4hrs 7mins
Takeoff
Bir Billing
Coords
Takeoff
32.05900, 76.74367
Start
32.05945, 76.74232
TP1
32.25010, 76.34800
Finish
32.05945, 76.74232
Landing
32.04183, 76.70867
Distance and Score
Distance
85.58k
Deductions
1.60k  (cylinders)
Total
83.98k
Multiplier
x 1.50
Score
126.0
Open Distance
Total
44.5k
Filename
Use full pilot name
Download
Validated
Yes
Flight map
Notes

This map gives an overview of the flight, using the turnpoints to plot the track.

Use the for a detailed map and flight track.

Duration 0:00   Takeoff Distance 0
Controls
To animate the flight: click a point on the track, use the slider, or click the Play button.
slider
slider
Speed
Speed
Slower
Faster
Track color
No data
Highlights
Track data
Time: No data
Height:
Climb:
Speed:
Interval:
Units
Height: metres
Climb: m/sec
Speed: km/h
Distance: km
chart
Notes

Climb and Speed averaged over 4 second intervals.

These values may be lower than those shown by a flight instrument, which has access to continuous raw data.

Metric units are used for all chart data, except for Height which is shown in feet.

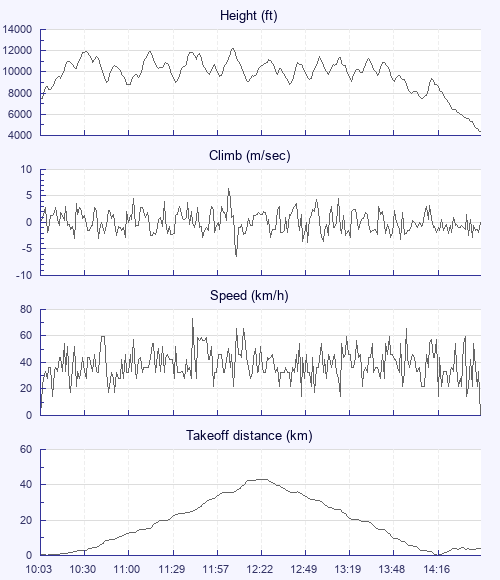
Height   -   Pressure data
Maximum Height
[12:07:01]
12165 ft
Lowest Save
[14:07:59]
7490 ft
Takeoff Height
[10:03:28]
7493 ft
Landing Height
[14:43:49]
4364 ft
Total Ascent 39715 ft
Height Gain
Above Takeoff 4672 ft
Maximum 4757 ft
Low Point
[10:04:12]
7408 ft
High Point
as Maximum Height
12165 ft
Units
Climb   -   Pressure data
Maximum Climb
[12:05:09]
6.5 m/s
Minimum Climb
[12:08:21]
-6.5 m/s
Units
Speed
Maximum Speed
[11:42:09]
72.9 km/h
Average Speed
around course
20.4 km/h
Average Speed
over track length
38.6 km/h
Units
Tracklog
Flight Duration 4hrs 40mins
Track Points 4210
Recording Interval 4 secs
Statistics Interval 4 secs
Track Length 180.2 km
Units
Flight instrument   -   reported as
AIRCOTEC SN:1581 SW:1.4
Notes

Climb and Speed averaged over 4 second intervals.

These values may be lower than those shown by a flight instrument, which has access to continuous raw data.

Average Speed around course is measured from Start to Finish points.

Track Length is the cumulative distance between track points from Takeoff to Landing.

You can change the default units displayed - see the Options page.

Use this page to set various display Options. You can choose which units are used to display flight data, which map to show when the starts and which tab to show each time you view a flight.
Units settings

Metric units are used by default for the Statistics and XC Player pages, except for Height data which is shown in feet. You can choose your own custom settings here.

Height:
Speed:
Climb:
Distance:
  Use default
XC Player settings

When the XC Player starts, the track data is shown on the Hybrid map. You can choose a different map here.

Main Map:
  Use default
Tab settings

The first tab shown when you view a flight is the Flight Map. You can choose a different tab here.

First Tab:
  Use default
Notes

This page uses cookies to save your settings for future visits.

If you have disabled cookies for this site then any changes you make will not be saved.