


| Duration | 0:00 | Takeoff Distance | 0 |
| Height: | metres |
| Climb: | m/sec |
| Speed: | km/h |
| Distance: | km |
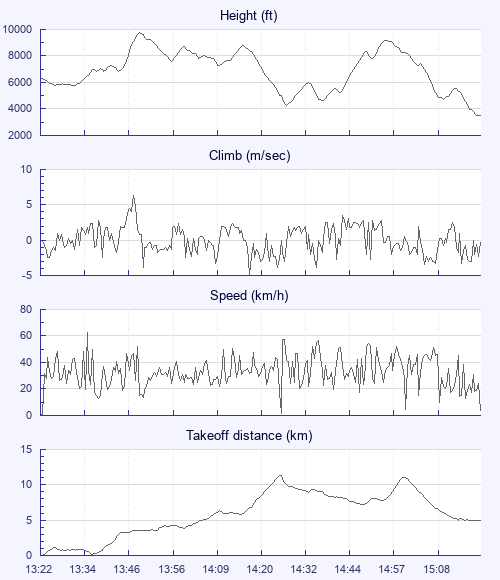
| Height - GPS data | |
| Maximum Height [13:48:57] |
9738 ft |
| Lowest Save [14:29:19] |
4272 ft |
| Takeoff Height [13:22:39] |
6312 ft |
| Landing Height [15:22:46] |
3494 ft |
| Total Ascent | 18776 ft |
| Height Gain | |
| Above Takeoff | 3425 ft |
| Maximum | 4931 ft |
| Low Point as Lowest Save |
4272 ft |
| High Point [14:57:31] |
9203 ft |
| Units | |
| Climb - Pressure data | |
| Maximum Climb [13:48:03] |
6.3 m/s |
| Minimum Climb [14:19:35] |
-4.8 m/s |
| Units | |
| Speed | |
| Maximum Speed [13:35:19] |
63.0 km/h |
| Average Speed around course |
16.3 km/h |
| Average Speed over track length |
34.2 km/h |
| Units | |
| Tracklog | |
| Flight Duration | 2hrs |
| Track Points | 7208 |
| Recording Interval | 1 secs |
| Statistics Interval | 4 secs |
| Track Length | 68.4 km |
| Units | |
| Flight instrument | |
| Type | Xc_tracer_maxx |
| Model | Not Set |
| Firmware | Xc_tracer_maxx_r07 |
| Height: | |
| Speed: | |
| Climb: | |
| Distance: |
| Main Map: |
| First Tab: |