Xc Title
User:Guest
Naviter advert
Jan Kott  All flights
Overseas League 2022
Flight type image
Turnpoint Flight on a Paraglider
Club
XC Junkies
Glider
Ozone zeno
Date
5th August 2022
Start
11:58
Finish
16:11
Duration
4hrs 12mins
Takeoff
gora zar
Landing
Lud?mierz
Coords
Takeoff
49.78705, 19.22452
Start
49.78690, 19.22493
TP1
49.73420, 19.00153
TP2
49.65435, 19.08775
TP3
49.65510, 19.37278
Finish
49.45462, 19.98507
Landing
49.45425, 19.98450
Distances and Score
Leg 1
17.13k
Leg 2
10.84k
Leg 3
20.58k
Leg 4
49.60k
Total
98.15k
Score
98.2
Open Distance
Total
77.6k
Filename
Use full pilot name
Download
Validated
No
Flight map
Notes

This map gives an overview of the flight, using the turnpoints to plot the track.

Use the for a detailed map and flight track.

Duration 0:00   Takeoff Distance 0
Controls
To animate the flight: click a point on the track, use the slider, or click the Play button.
slider
slider
Speed
Speed
Slower
Faster
Track color
No data
Highlights
Track data
Time: No data
Height:
Climb:
Speed:
Interval:
Units
Height: metres
Climb: m/sec
Speed: km/h
Distance: km
chart
Notes

Climb and Speed averaged over 10 second intervals.

These values may be lower than those shown by a flight instrument, which has access to continuous raw data.

Red values indicate suspect data, because the tracklog contains invalid points.

Metric units are used for all chart data, except for Height which is shown in feet.

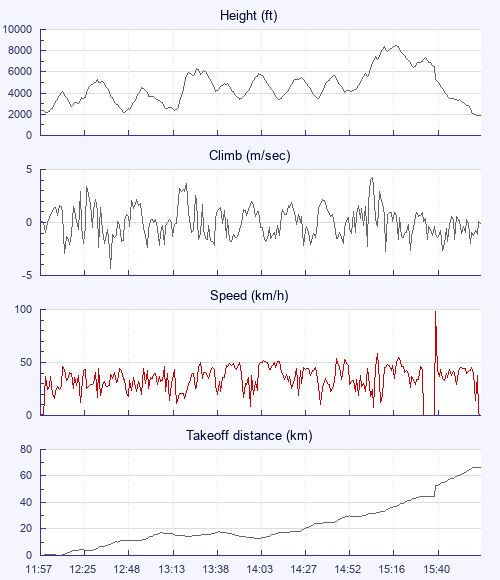
Height   -   Pressure data
Maximum Height
[15:23:00]
8458 ft
Lowest Save
[12:47:00]
2185 ft
Takeoff Height
[11:57:47]
2316 ft
Landing Height
[16:12:04]
1903 ft
Total Ascent 28366 ft
Height Gain
Above Takeoff 6142 ft
Maximum 6368 ft
Low Point
[12:03:17]
2090 ft
High Point
as Maximum Height
8458 ft
Units
Climb   -   Pressure data
Maximum Climb
[15:10:10]
4.2 m/s
Minimum Climb
[12:40:40]
-4.3 m/s
Units
Speed
Maximum Speed
[15:49:42]
98.3 km/h
Average Speed
around course
23.3 km/h
Average Speed
over track length
34.4 km/h
Units
Tracklog
Flight Duration 4hrs 14mins
Track Points 1505
Recording Interval 10 secs
Statistics Interval 10 secs
Track Length 146.0 km
Invalid Positions
[2%]
30
Units
Flight instrument
Type Brauniger
Model Compeo+
Firmware 3.37z
Notes

Climb and Speed averaged over 10 second intervals.

These values may be lower than those shown by a flight instrument, which has access to continuous raw data.

Red values indicate suspect data, because the tracklog contains invalid points.

Average Speed around course is measured from Start to Finish points.

Track Length is the cumulative distance between track points from Takeoff to Landing.

You can change the default units displayed - see the Options page.

Use this page to set various display Options. You can choose which units are used to display flight data, which map to show when the starts and which tab to show each time you view a flight.
Units settings

Metric units are used by default for the Statistics and XC Player pages, except for Height data which is shown in feet. You can choose your own custom settings here.

Height:
Speed:
Climb:
Distance:
  Use default
XC Player settings

When the XC Player starts, the track data is shown on the Hybrid map. You can choose a different map here.

Main Map:
  Use default
Tab settings

The first tab shown when you view a flight is the Flight Map. You can choose a different tab here.

First Tab:
  Use default
Notes

This page uses cookies to save your settings for future visits.

If you have disabled cookies for this site then any changes you make will not be saved.