


| Duration | 0:00 | Takeoff Distance | 0 |
| Height: | metres |
| Climb: | m/sec |
| Speed: | km/h |
| Distance: | km |
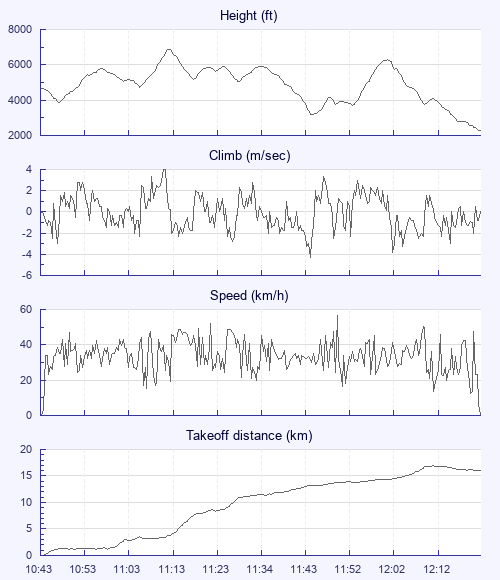
| Height - GPS data | |
| Maximum Height [11:13:04] |
6877 ft |
| Lowest Save [11:45:15] |
3163 ft |
| Takeoff Height [10:43:41] |
4678 ft |
| Landing Height [12:22:07] |
2270 ft |
| Total Ascent | 12352 ft |
| Height Gain | |
| Above Takeoff | 2198 ft |
| Maximum | 3130 ft |
| Low Point as Lowest Save |
3163 ft |
| High Point [12:01:41] |
6293 ft |
| Units | |
| Climb - Pressure data | |
| Maximum Climb [11:11:45] |
4.0 m/s |
| Minimum Climb [11:45:09] |
-4.3 m/s |
| Units | |
| Speed | |
| Maximum Speed [11:50:25] |
56.7 km/h |
| Average Speed around course |
13.8 km/h |
| Average Speed over track length |
34.6 km/h |
| Units | |
| Tracklog | |
| Flight Duration | 1hr 38mins |
| Track Points | 5907 |
| Recording Interval | 1 secs |
| Statistics Interval | 4 secs |
| Track Length | 56.8 km |
| Units | |
| Flight instrument | |
| Type | Oudie 4 Basic |
| Model | Y |
| Firmware | 9.31.001 |
| Height: | |
| Speed: | |
| Climb: | |
| Distance: |
| Main Map: |
| First Tab: |