


| Duration | 0:00 | Takeoff Distance | 0 |
| Height: | metres |
| Climb: | m/sec |
| Speed: | km/h |
| Distance: | km |
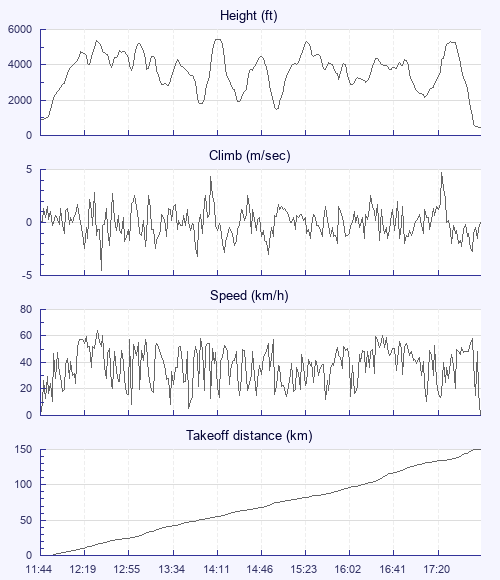
| Height - GPS data | |
| Maximum Height [14:12:31] |
5453 ft |
| Lowest Save [15:00:51] |
1493 ft |
| Takeoff Height [11:44:49] |
886 ft |
| Landing Height [17:54:59] |
436 ft |
| Total Ascent | 28714 ft |
| Height Gain | |
| Above Takeoff | 4567 ft |
| Units | |
| Climb - Pressure data | |
| Maximum Climb [17:26:52] |
4.7 m/s |
| Minimum Climb [12:32:15] |
-4.5 m/s |
| Units | |
| Speed | |
| Maximum Speed [12:30:21] |
64.2 km/h |
| Average Speed around course |
24.8 km/h |
| Average Speed over track length |
37.7 km/h |
| Units | |
| Tracklog | |
| Flight Duration | 6hrs 10mins |
| Track Points | 7401 |
| Recording Interval | 3 secs |
| Statistics Interval | 6 secs |
| Track Length | 232.3 km |
| Units | |
| Flight instrument | |
| Type | Mycloudbase |
| Model | Tracker (sm-g950f) |
| Firmware | 8.4 |
| Height: | |
| Speed: | |
| Climb: | |
| Distance: |
| Main Map: |
| First Tab: |