Xc Title
User:Guest
Naviter advert
Robert Mepham  All flights
Armed Forces League 2022
Flight type image
Tow-launch Turnpoint Flight on a Paraglider
Club
Armed Forces
Glider
Advance Sigma 11
Date
29th July 2022
Start
11:33
Finish
15:27
Duration
3hrs 54mins
Takeoff
North Luffenham
Landing
Nr Gretton
Coords
Takeoff
52.62815, -0.61253
Start
52.62963, -0.60458
TP1
52.48643, -0.81997
TP2
52.47400, -1.01162
TP3
52.51412, -0.66353
Finish
52.54667, -0.66302
Landing
52.54667, -0.66302
Distances and Score
Leg 1
21.62k
Leg 2
13.09k
Leg 3
24.06k
Leg 4
3.62k
Total
62.39k
Score
62.4
Open Distance
Total
32.6k
Filename
Use full pilot name
Download
Validated
Yes
Flight map
Notes

This map gives an overview of the flight, using the turnpoints to plot the track.

Use the for a detailed map and flight track.

Duration 0:00   Takeoff Distance 0
Controls
To animate the flight: click a point on the track, use the slider, or click the Play button.
slider
slider
Speed
Speed
Slower
Faster
Track color
No data
Highlights
Track data
Time: No data
Height:
Climb:
Speed:
Interval:
Units
Height: metres
Climb: m/sec
Speed: km/h
Distance: km
chart
Notes

Climb and Speed averaged over 4 second intervals.

These values may be lower than those shown by a flight instrument, which has access to continuous raw data.

Red values indicate suspect data, because the tracklog contains invalid points.

Metric units are used for all chart data, except for Height which is shown in feet.

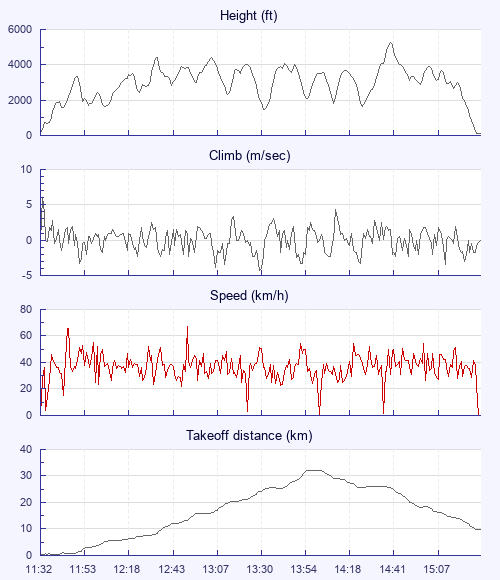
Height   -   Pressure data
Maximum Height
[14:40:35]
5236 ft
Lowest Save
[13:31:36]
1457 ft
Takeoff Height
[11:32:39]
102 ft
Landing Height
[15:28:06]
115 ft
Total Ascent 28990 ft
Height Gain
Above Takeoff 5135 ft
Maximum 5138 ft
Low Point
[11:32:47]
98 ft
High Point
as Maximum Height
5236 ft
Units
Climb   -   Pressure data
Maximum Climb
[11:33:08]
6.0 m/s
Minimum Climb
[13:30:37]
-4.3 m/s
Units
Speed
Maximum Speed
[12:50:57]
67.5 km/h
Average Speed
around course
16.0 km/h
Average Speed
over track length
36.5 km/h
Units
Tracklog
Flight Duration 3hrs 55mins
Track Points 14120
Recording Interval 1 secs
Statistics Interval 4 secs
Track Length 143.2 km
Invalid Positions
[< 1%]
15
Units
Flight instrument
Type Motorola Moto G(8) Power 11
Model Not Set
Firmware 0.9.7.6
Notes

Climb and Speed averaged over 4 second intervals.

These values may be lower than those shown by a flight instrument, which has access to continuous raw data.

Red values indicate suspect data, because the tracklog contains invalid points.

Average Speed around course is measured from Start to Finish points.

Track Length is the cumulative distance between track points from Takeoff to Landing.

You can change the default units displayed - see the Options page.

Use this page to set various display Options. You can choose which units are used to display flight data, which map to show when the starts and which tab to show each time you view a flight.
Units settings

Metric units are used by default for the Statistics and XC Player pages, except for Height data which is shown in feet. You can choose your own custom settings here.

Height:
Speed:
Climb:
Distance:
  Use default
XC Player settings

When the XC Player starts, the track data is shown on the Hybrid map. You can choose a different map here.

Main Map:
  Use default
Tab settings

The first tab shown when you view a flight is the Flight Map. You can choose a different tab here.

First Tab:
  Use default
Notes

This page uses cookies to save your settings for future visits.

If you have disabled cookies for this site then any changes you make will not be saved.