Xc Title
User:Guest
Cloudbase Paragliding advert
Mark Nicol  All flights
Overseas League 2022
Flight type image
Turnpoint Flight on a Paraglider
Club
South Devon
Glider
Advance Iota 2
Date
9th July 2022
Start
14:27
Finish
16:48
Duration
2hrs 20mins
Takeoff
Cuarnan, Gemona
Landing
Nr Bordano
Coords
Takeoff
46.27402, 13.17562
Start
46.27320, 13.18127
TP1
46.27297, 13.03320
TP2
46.23155, 13.26290
TP3
46.27262, 13.03520
Finish
46.33123, 13.10487
Landing
46.30920, 13.11305
Distances and Score
Leg 1
11.41k
Leg 2
18.30k
Leg 3
18.14k
Leg 4
8.44k
Total
56.29k
Score
56.3
Open Distance
Total
18.3k
Filename
Use full pilot name
Download
Validated
No
Flight map
Notes

This map gives an overview of the flight, using the turnpoints to plot the track.

Use the for a detailed map and flight track.

Duration 0:00   Takeoff Distance 0
Controls
To animate the flight: click a point on the track, use the slider, or click the Play button.
slider
slider
Speed
Speed
Slower
Faster
Track color
No data
Highlights
Track data
Time: No data
Height:
Climb:
Speed:
Interval:
Units
Height: metres
Climb: m/sec
Speed: km/h
Distance: km
chart
Notes

Climb and Speed averaged over 4 second intervals.

These values may be lower than those shown by a flight instrument, which has access to continuous raw data.

Metric units are used for all chart data, except for Height which is shown in feet.

Height   -   GPS data
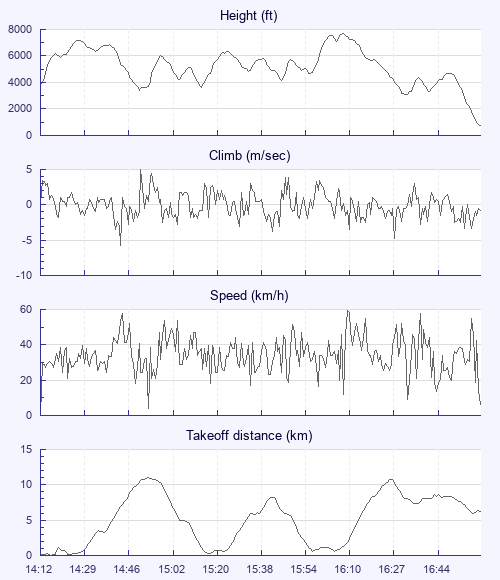
Maximum Height
[16:09:45]
7671 ft
Lowest Save
[16:33:11]
3110 ft
Takeoff Height
[14:12:58]
3845 ft
Landing Height
[17:00:37]
725 ft
Total Ascent 22379 ft
Height Gain
Above Takeoff 3825 ft
Maximum 4314 ft
Low Point
[14:51:19]
3356 ft
High Point
as Maximum Height
7671 ft
Units
Climb   -   Pressure data
Maximum Climb
[14:51:42]
5.0 m/s
Minimum Climb
[14:44:18]
-5.8 m/s
Units
Speed
Maximum Speed
[16:10:30]
59.4 km/h
Average Speed
around course
24.0 km/h
Average Speed
over track length
34.8 km/h
Units
Tracklog
Flight Duration 2hrs 47mins
Track Points 10060
Recording Interval 1 secs
Statistics Interval 4 secs
Track Length 97.1 km
Units
Flight instrument
Type Flymaster
Model Gps
Firmware 2.03e
Notes

Climb and Speed averaged over 4 second intervals.

These values may be lower than those shown by a flight instrument, which has access to continuous raw data.

Average Speed around course is measured from Start to Finish points.

Track Length is the cumulative distance between track points from Takeoff to Landing.

You can change the default units displayed - see the Options page.

Practice day for 5he British Sports Trophy comp. Didnt have the waypoints loaded in my instrument so followed other pilots as best I could.

Use this page to set various display Options. You can choose which units are used to display flight data, which map to show when the starts and which tab to show each time you view a flight.
Units settings

Metric units are used by default for the Statistics and XC Player pages, except for Height data which is shown in feet. You can choose your own custom settings here.

Height:
Speed:
Climb:
Distance:
  Use default
XC Player settings

When the XC Player starts, the track data is shown on the Hybrid map. You can choose a different map here.

Main Map:
  Use default
Tab settings

The first tab shown when you view a flight is the Flight Map. You can choose a different tab here.

First Tab:
  Use default
Notes

This page uses cookies to save your settings for future visits.

If you have disabled cookies for this site then any changes you make will not be saved.