


| Duration | 0:00 | Takeoff Distance | 0 |
| Height: | metres |
| Climb: | m/sec |
| Speed: | km/h |
| Distance: | km |
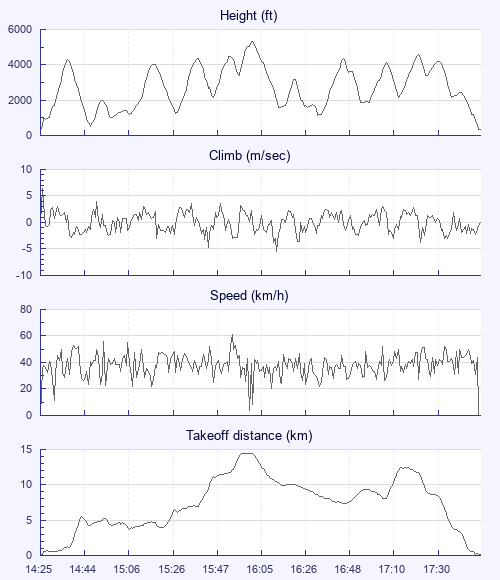
| Height - GPS data | |
| Maximum Height [16:05:09] |
5335 ft |
| Lowest Save [14:47:52] |
505 ft |
| Takeoff Height [14:25:20] |
318 ft |
| Landing Height [17:56:50] |
328 ft |
| Total Ascent | 31765 ft |
| Height Gain | |
| Above Takeoff | 5016 ft |
| Maximum | 5020 ft |
| Low Point [14:25:21] |
315 ft |
| High Point as Maximum Height |
5335 ft |
| Units | |
| Climb - GPS data | |
| Maximum Climb [14:25:40] |
6.5 m/s |
| Minimum Climb [16:16:28] |
-5.5 m/s |
| Units | |
| Speed | |
| Maximum Speed [15:57:52] |
61.2 km/h |
| Average Speed around course |
12.4 km/h |
| Average Speed over track length |
38.4 km/h |
| Units | |
| Tracklog | |
| Flight Duration | 3hrs 31mins |
| Track Points | 12691 |
| Recording Interval | 1 secs |
| Statistics Interval | 4 secs |
| Track Length | 135.4 km |
| Units | |
| Flight instrument - reported as | |
| NMEA |
| Height: | |
| Speed: | |
| Climb: | |
| Distance: |
| Main Map: |
| First Tab: |