


| Duration | 0:00 | Takeoff Distance | 0 |
| Height: | metres |
| Climb: | m/sec |
| Speed: | km/h |
| Distance: | km |
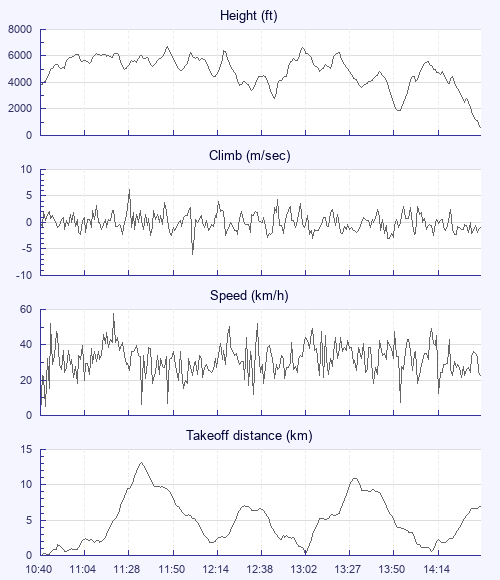
| Height - GPS data | |
| Maximum Height [11:48:49] |
6703 ft |
| Lowest Save [13:55:50] |
1900 ft |
| Takeoff Height [10:40:39] |
3855 ft |
| Landing Height [14:40:21] |
587 ft |
| Total Ascent | 31877 ft |
| Height Gain | |
| Above Takeoff | 2848 ft |
| Maximum | 3953 ft |
| Low Point [12:46:20] |
2677 ft |
| High Point [13:02:31] |
6631 ft |
| Units | |
| Climb - Pressure data | |
| Maximum Climb [11:28:51] |
6.3 m/s |
| Minimum Climb [12:02:31] |
-6.0 m/s |
| Units | |
| Speed | |
| Maximum Speed [11:21:03] |
57.6 km/h |
| Average Speed around course |
17.7 km/h |
| Average Speed over track length |
32.9 km/h |
| Units | |
| Tracklog | |
| Flight Duration | 3hrs 59mins |
| Track Points | 14383 |
| Recording Interval | 1 secs |
| Statistics Interval | 4 secs |
| Track Length | 131.3 km |
| Units | |
| Flight instrument | |
| Type | Na |
| Model | Not Set |
| Firmware | Not Set |
| Height: | |
| Speed: | |
| Climb: | |
| Distance: |
| Main Map: |
| First Tab: |