


| Duration | 0:00 | Takeoff Distance | 0 |
| Height: | metres |
| Climb: | m/sec |
| Speed: | km/h |
| Distance: | km |
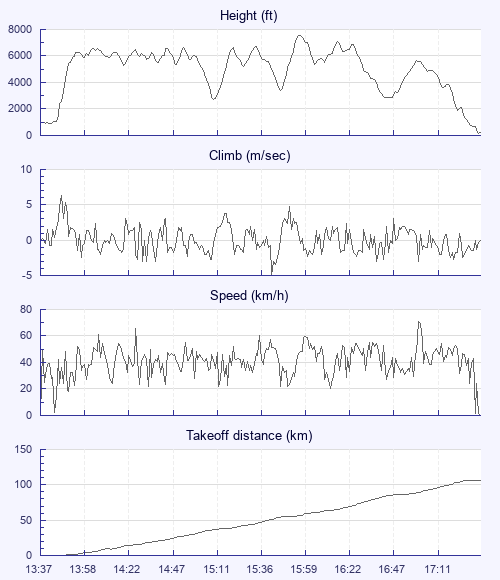
| Height - GPS data | |
| Maximum Height [15:55:48] |
7562 ft |
| Lowest Save [15:09:44] |
2720 ft |
| Takeoff Height [13:37:12] |
886 ft |
| Landing Height [17:31:43] |
190 ft |
| Total Ascent | 34551 ft |
| Height Gain | |
| Above Takeoff | 6677 ft |
| Maximum | 6696 ft |
| Low Point [13:42:36] |
866 ft |
| High Point as Maximum Height |
7562 ft |
| Units | |
| Climb - Pressure data | |
| Maximum Climb [13:46:24] |
6.3 m/s |
| Minimum Climb [15:41:44] |
-5.0 m/s |
| Units | |
| Speed | |
| Maximum Speed [17:00:46] |
71.1 km/h |
| Average Speed around course |
29.8 km/h |
| Average Speed over track length |
41.3 km/h |
| Units | |
| Tracklog | |
| Flight Duration | 3hrs 54mins |
| Track Points | 14065 |
| Recording Interval | 1 secs |
| Statistics Interval | 4 secs |
| Track Length | 161.5 km |
| Units | |
| Flight instrument | |
| Type | Flyskyhy |
| Model | 7.3.2 |
| Firmware | 7.3.2 |
| Height: | |
| Speed: | |
| Climb: | |
| Distance: |
| Main Map: |
| First Tab: |