


| Duration | 0:00 | Takeoff Distance | 0 |
| Height: | metres |
| Climb: | m/sec |
| Speed: | km/h |
| Distance: | km |
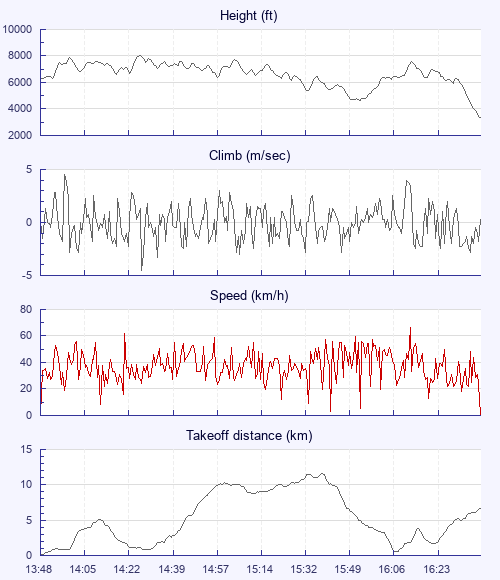
| Height - GPS data | |
| Maximum Height [14:27:44] |
8018 ft |
| Lowest Save [15:56:27] |
4669 ft |
| Takeoff Height [13:48:48] |
6299 ft |
| Landing Height [16:46:13] |
3346 ft |
| Total Ascent | 21519 ft |
| Height Gain | |
| Above Takeoff | 1719 ft |
| Maximum | 2943 ft |
| Low Point as Lowest Save |
4669 ft |
| High Point [16:16:59] |
7612 ft |
| Units | |
| Climb - Pressure data | |
| Maximum Climb [13:58:16] |
4.5 m/s |
| Minimum Climb [14:28:04] |
-4.5 m/s |
| Units | |
| Speed | |
| Maximum Speed [16:16:32] |
66.6 km/h |
| Average Speed around course |
17.4 km/h |
| Average Speed over track length |
37.2 km/h |
| Units | |
| Tracklog | |
| Flight Duration | 2hrs 57mins |
| Track Points | 10646 |
| Recording Interval | 1 secs |
| Statistics Interval | 4 secs |
| Track Length | 109.9 km |
| Invalid Positions [< 1%] |
1 |
| Units | |
| Flight instrument | |
| Type | Oudie 5 Pro |
| Model | Not Set |
| Firmware | 9.25.001 |
| Height: | |
| Speed: | |
| Climb: | |
| Distance: |
| Main Map: |
| First Tab: |