


| Duration | 0:00 | Takeoff Distance | 0 |
| Height: | metres |
| Climb: | m/sec |
| Speed: | km/h |
| Distance: | km |
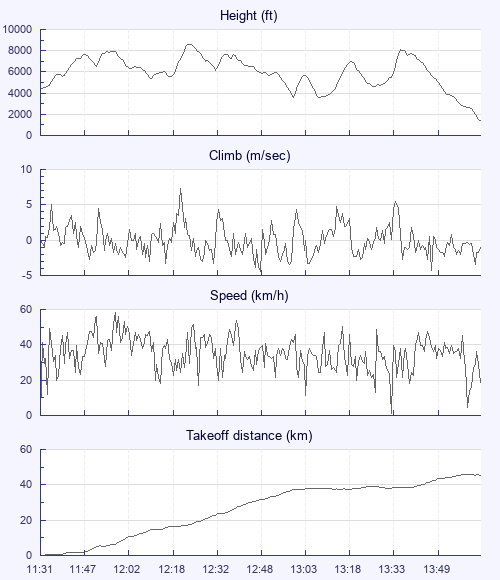
| Height - GPS data | |
| Maximum Height [12:24:25] |
8632 ft |
| Lowest Save [13:09:35] |
3573 ft |
| Takeoff Height [11:31:58] |
4521 ft |
| Landing Height [14:04:40] |
1421 ft |
| Total Ascent | 24295 ft |
| Height Gain | |
| Above Takeoff | 4111 ft |
| Maximum | 4567 ft |
| Low Point as Lowest Save |
3573 ft |
| High Point [13:37:22] |
8140 ft |
| Units | |
| Climb - GPS data | |
| Maximum Climb [12:21:31] |
7.3 m/s |
| Minimum Climb [12:48:43] |
-4.5 m/s |
| Units | |
| Speed | |
| Maximum Speed [11:58:03] |
58.5 km/h |
| Average Speed around course |
23.7 km/h |
| Average Speed over track length |
35.8 km/h |
| Units | |
| Tracklog | |
| Flight Duration | 2hrs 32mins |
| Track Points | 9152 |
| Recording Interval | 1 secs |
| Statistics Interval | 4 secs |
| Track Length | 91.1 km |
| Units | |
| Flight instrument | |
| Type | Naviter |
| Model | Seeyou Navigator |
| Firmware | 2.4.4 |
| Height: | |
| Speed: | |
| Climb: | |
| Distance: |
| Main Map: |
| First Tab: |