Xc Title
User:Guest
Naviter advert
Stephen Pym  All flights
National League 2022
Flight type image
Declared FAI Triangle on a Paraglider
Club
Long Mynd
Glider
Ozone Zeno
Date
22nd June 2022
Start
13:16
Finish
16:08
Duration
2hrs 51mins
Takeoff
The Wrekin
Coords
Takeoff
52.66970, -2.55188
Start
52.67122, -2.54577
TP1
52.72843, -2.70875
TP2
52.58382, -2.73118
Finish
52.67122, -2.54577
Landing
52.67790, -2.54990
Distances and Score
Leg 1
12.73k
Leg 2
16.16k
Leg 3
15.88k
Distance
44.77k
Deductions
2.40k  (cylinders)
Total
42.37k
Multiplier
x 3.00
Score
127.1
Open Distance
Total
19.3k
Filename
Use full pilot name
Download
Validated
Yes
Flight map
Notes

This map gives an overview of the flight, using the turnpoints to plot the track.

Use the for a detailed map and flight track.

Duration 0:00   Takeoff Distance 0
Controls
To animate the flight: click a point on the track, use the slider, or click the Play button.
slider
slider
Speed
Speed
Slower
Faster
Track color
No data
Highlights
Track data
Time: No data
Height:
Climb:
Speed:
Interval:
Units
Height: metres
Climb: m/sec
Speed: km/h
Distance: km
chart
Notes

Climb and Speed averaged over 4 second intervals.

These values may be lower than those shown by a flight instrument, which has access to continuous raw data.

Red values indicate suspect data, because the tracklog contains invalid points.

Metric units are used for all chart data, except for Height which is shown in feet.

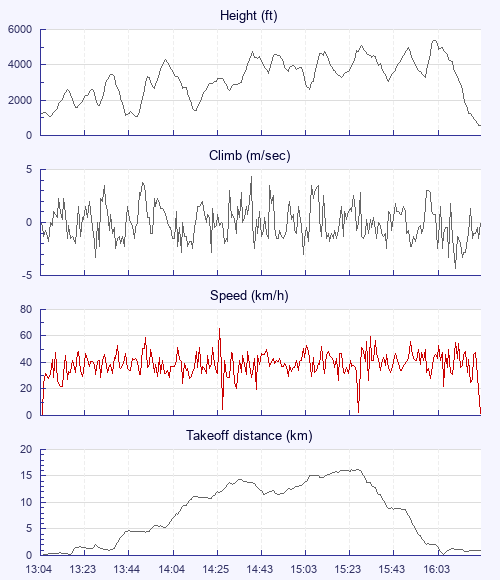
Height   -   Pressure data
Maximum Height
[16:04:43]
5377 ft
Lowest Save
[13:48:27]
1053 ft
Takeoff Height
[13:04:39]
1234 ft
Landing Height
[16:23:58]
541 ft
Total Ascent 26562 ft
Height Gain
Above Takeoff 4144 ft
Maximum 4324 ft
Low Point
as Lowest Save
1053 ft
High Point
as Maximum Height
5377 ft
Units
Climb   -   Pressure data
Maximum Climb
[14:40:19]
4.3 m/s
Minimum Climb
[16:12:56]
-4.3 m/s
Units
Speed
Maximum Speed
[14:27:31]
65.7 km/h
Average Speed
around course
14.8 km/h
Average Speed
over track length
37.9 km/h
Units
Tracklog
Flight Duration 3hrs 19mins
Track Points 11960
Recording Interval 1 secs
Statistics Interval 4 secs
Track Length 125.8 km
Invalid Positions
[< 1%]
1
Units
Flight instrument
Type Oudie 5 Pro
Model R
Firmware 9.37.001
Notes

Climb and Speed averaged over 4 second intervals.

These values may be lower than those shown by a flight instrument, which has access to continuous raw data.

Red values indicate suspect data, because the tracklog contains invalid points.

Average Speed around course is measured from Start to Finish points.

Track Length is the cumulative distance between track points from Takeoff to Landing.

You can change the default units displayed - see the Options page.

Use this page to set various display Options. You can choose which units are used to display flight data, which map to show when the starts and which tab to show each time you view a flight.
Units settings

Metric units are used by default for the Statistics and XC Player pages, except for Height data which is shown in feet. You can choose your own custom settings here.

Height:
Speed:
Climb:
Distance:
  Use default
XC Player settings

When the XC Player starts, the track data is shown on the Hybrid map. You can choose a different map here.

Main Map:
  Use default
Tab settings

The first tab shown when you view a flight is the Flight Map. You can choose a different tab here.

First Tab:
  Use default
Notes

This page uses cookies to save your settings for future visits.

If you have disabled cookies for this site then any changes you make will not be saved.