


| Duration | 0:00 | Takeoff Distance | 0 |
| Height: | metres |
| Climb: | m/sec |
| Speed: | km/h |
| Distance: | km |
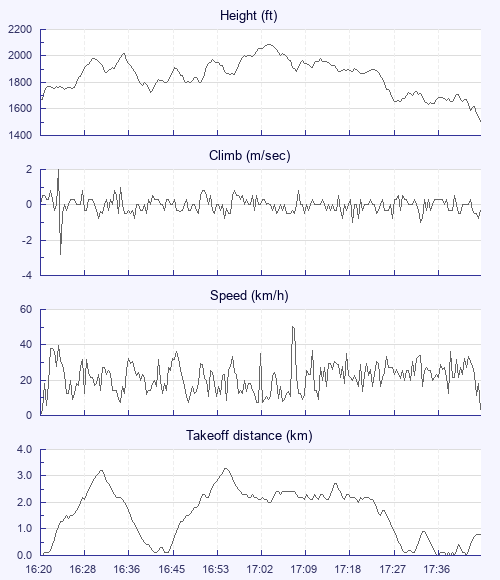
| Height - GPS data | |
| Maximum Height [17:03:39] |
2090 ft |
| Takeoff Height [16:20:33] |
1663 ft |
| Landing Height [17:44:25] |
1509 ft |
| Total Ascent | 4472 ft |
| Height Gain | |
| Above Takeoff | 427 ft |
| Maximum | 433 ft |
| Low Point [16:20:49] |
1657 ft |
| High Point as Maximum Height |
2090 ft |
| Units | |
| Climb - Pressure data | |
| Maximum Climb [16:23:45] |
2.0 m/s |
| Minimum Climb [16:24:05] |
-2.8 m/s |
| Units | |
| Speed | |
| Maximum Speed [17:07:41] |
50.4 km/h |
| Average Speed around course |
10.5 km/h |
| Average Speed over track length |
21.8 km/h |
| Units | |
| Tracklog | |
| Flight Duration | 1hr 23mins |
| Track Points | 5033 |
| Recording Interval | 1 secs |
| Statistics Interval | 4 secs |
| Track Length | 30.5 km |
| Units | |
| Flight instrument | |
| Type | Xiaomi M2004j19c 10 |
| Model | Not Set |
| Firmware | 0.9.5.3 |
| Height: | |
| Speed: | |
| Climb: | |
| Distance: |
| Main Map: |
| First Tab: |