


| Duration | 0:00 | Takeoff Distance | 0 |
| Height: | metres |
| Climb: | m/sec |
| Speed: | km/h |
| Distance: | km |
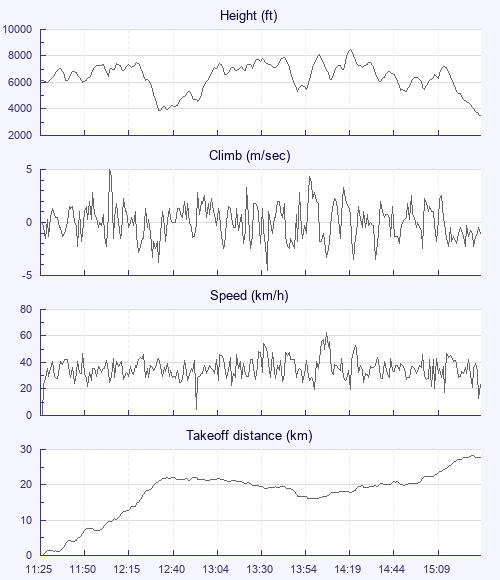
| Height - GPS data | |
| Maximum Height [14:19:56] |
8527 ft |
| Lowest Save [12:33:09] |
3855 ft |
| Takeoff Height [11:25:29] |
6171 ft |
| Landing Height [15:32:20] |
3491 ft |
| Total Ascent | 30581 ft |
| Height Gain | |
| Above Takeoff | 2356 ft |
| Maximum | 4672 ft |
| Low Point as Lowest Save |
3855 ft |
| High Point as Maximum Height |
8527 ft |
| Units | |
| Climb - Pressure data | |
| Maximum Climb [12:05:21] |
5.0 m/s |
| Minimum Climb [13:33:37] |
-4.5 m/s |
| Units | |
| Speed | |
| Maximum Speed [14:07:13] |
63.0 km/h |
| Average Speed around course |
15.7 km/h |
| Average Speed over track length |
36.0 km/h |
| Units | |
| Tracklog | |
| Flight Duration | 4hrs 6mins |
| Track Points | 14812 |
| Recording Interval | 1 secs |
| Statistics Interval | 4 secs |
| Track Length | 148.3 km |
| Units | |
| Flight instrument - reported as | |
| SKYTRAXX |
| Height: | |
| Speed: | |
| Climb: | |
| Distance: |
| Main Map: |
| First Tab: |