


| Duration | 0:00 | Takeoff Distance | 0 |
| Height: | metres |
| Climb: | m/sec |
| Speed: | km/h |
| Distance: | km |
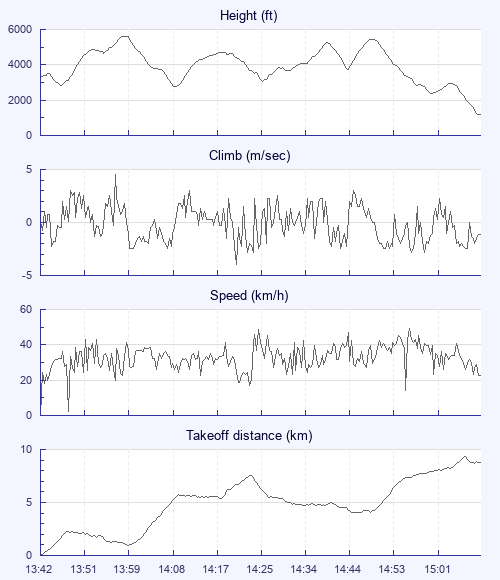
| Height - GPS data | |
| Maximum Height [13:59:02] |
5623 ft |
| Lowest Save [15:02:25] |
2382 ft |
| Takeoff Height [13:42:50] |
3392 ft |
| Landing Height [15:12:21] |
1168 ft |
| Total Ascent | 11608 ft |
| Height Gain | |
| Above Takeoff | 2231 ft |
| Maximum | 2802 ft |
| Low Point [13:47:19] |
2822 ft |
| High Point as Maximum Height |
5623 ft |
| Units | |
| Climb - Pressure data | |
| Maximum Climb [13:57:54] |
4.5 m/s |
| Minimum Climb [14:22:34] |
-4.0 m/s |
| Units | |
| Speed | |
| Maximum Speed [14:58:18] |
49.5 km/h |
| Average Speed around course |
15.9 km/h |
| Average Speed over track length |
32.9 km/h |
| Units | |
| Tracklog | |
| Flight Duration | 1hr 29mins |
| Track Points | 5372 |
| Recording Interval | 1 secs |
| Statistics Interval | 4 secs |
| Track Length | 49.1 km |
| Units | |
| Flight instrument | |
| Type | Flymaster |
| Model | Nav |
| Firmware | 2.03e |
| Height: | |
| Speed: | |
| Climb: | |
| Distance: |
| Main Map: |
| First Tab: |