


| Duration | 0:00 | Takeoff Distance | 0 |
| Height: | metres |
| Climb: | m/sec |
| Speed: | km/h |
| Distance: | km |
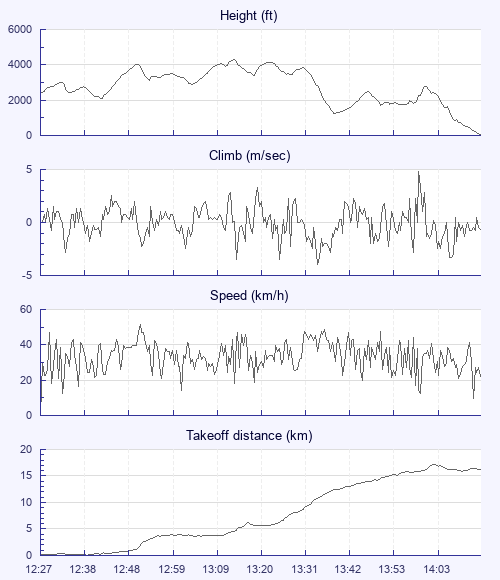
| Height - GPS data | |
| Maximum Height [13:14:40] |
4275 ft |
| Lowest Save [13:39:40] |
1243 ft |
| Takeoff Height [12:27:21] |
2385 ft |
| Landing Height [14:15:07] |
59 ft |
| Total Ascent | 12343 ft |
| Height Gain | |
| Above Takeoff | 1890 ft |
| Maximum | 2215 ft |
| Low Point [12:41:31] |
2060 ft |
| High Point as Maximum Height |
4275 ft |
| Units | |
| Climb - Pressure data | |
| Maximum Climb [14:01:05] |
4.8 m/s |
| Minimum Climb [13:35:37] |
-4.0 m/s |
| Units | |
| Speed | |
| Maximum Speed [12:51:37] |
51.3 km/h |
| Average Speed around course |
13.2 km/h |
| Average Speed over track length |
33.7 km/h |
| Units | |
| Tracklog | |
| Flight Duration | 1hr 47mins |
| Track Points | 6467 |
| Recording Interval | 1 secs |
| Statistics Interval | 4 secs |
| Track Length | 60.6 km |
| Units | |
| Flight instrument | |
| Type | Xc_tracer_ii_flarm |
| Model | Not Set |
| Firmware | Xc_tracer_ii_flarm_r09 |
| Height: | |
| Speed: | |
| Climb: | |
| Distance: |
| Main Map: |
| First Tab: |