Xc Title
User:Guest
Cloudbase Paragliding advert
Robert Matthews  All flights
National League 2022
Flight type image
Out and Return on a Paraglider
Club
LLSC
Glider
Ozone Alpina 3
Date
26th April 2022
Start
14:29
Finish
16:10
Duration
1hr 40mins
Takeoff
Glencoe
Coords
Takeoff
56.62797, -4.84065
Start
56.61975, -4.98840
TP1
56.61975, -4.98840
TP2
56.50472, -5.19238
Finish
56.61377, -4.99547
Landing
56.61377, -4.99547
Distance and Score
Distance
35.86k
Deductions
0.80k  (circuit gap 795m)
Total
35.06k
Multiplier
x 2.00
Score
70.1
Open Distance
Total
25.7k
Filename
Use full pilot name
Download
Validated
Yes
Flight map
Notes

This map gives an overview of the flight, using the turnpoints to plot the track.

Use the for a detailed map and flight track.

Duration 0:00   Takeoff Distance 0
Controls
To animate the flight: click a point on the track, use the slider, or click the Play button.
slider
slider
Speed
Speed
Slower
Faster
Track color
No data
Highlights
Track data
Time: No data
Height:
Climb:
Speed:
Interval:
Units
Height: metres
Climb: m/sec
Speed: km/h
Distance: km
chart
Notes

Climb and Speed averaged over 4 second intervals.

These values may be lower than those shown by a flight instrument, which has access to continuous raw data.

Red values indicate suspect data, because the tracklog contains invalid points.

Metric units are used for all chart data, except for Height which is shown in feet.

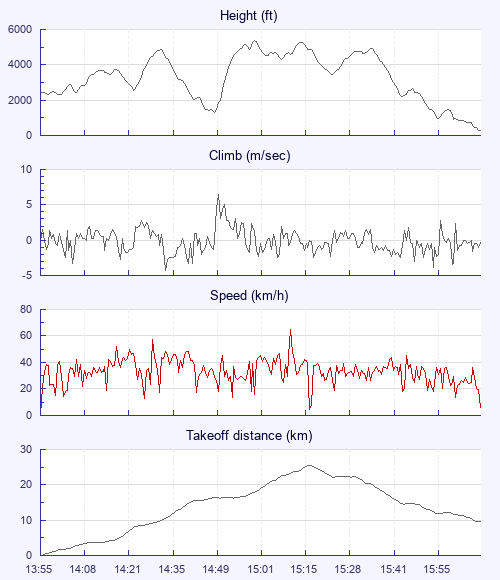
Height   -   Pressure data
Maximum Height
[15:01:00]
5400 ft
Lowest Save
[15:57:06]
974 ft
Takeoff Height
[13:55:20]
2405 ft
Landing Height
[16:10:14]
256 ft
Total Ascent 15049 ft
Height Gain
Above Takeoff 2995 ft
Maximum 4108 ft
Low Point
[14:48:39]
1293 ft
High Point
as Maximum Height
5400 ft
Units
Climb   -   Pressure data
Maximum Climb
[14:50:07]
6.5 m/s
Minimum Climb
[14:33:49]
-4.3 m/s
Units
Speed
Maximum Speed
[15:12:01]
64.8 km/h
Average Speed
around course
20.9 km/h
Average Speed
over track length
33.3 km/h
Units
Tracklog
Flight Duration 2hrs 14mins
Track Points 8013
Recording Interval 1 secs
Statistics Interval 4 secs
Track Length 74.9 km
Invalid Positions
[< 1%]
5
Units
Flight instrument
Type Flyskyhy
Model 7.3.2
Firmware 7.3.2
Notes

Climb and Speed averaged over 4 second intervals.

These values may be lower than those shown by a flight instrument, which has access to continuous raw data.

Red values indicate suspect data, because the tracklog contains invalid points.

Average Speed around course is measured from Start to Finish points.

Track Length is the cumulative distance between track points from Takeoff to Landing.

You can change the default units displayed - see the Options page.

Use this page to set various display Options. You can choose which units are used to display flight data, which map to show when the starts and which tab to show each time you view a flight.
Units settings

Metric units are used by default for the Statistics and XC Player pages, except for Height data which is shown in feet. You can choose your own custom settings here.

Height:
Speed:
Climb:
Distance:
  Use default
XC Player settings

When the XC Player starts, the track data is shown on the Hybrid map. You can choose a different map here.

Main Map:
  Use default
Tab settings

The first tab shown when you view a flight is the Flight Map. You can choose a different tab here.

First Tab:
  Use default
Notes

This page uses cookies to save your settings for future visits.

If you have disabled cookies for this site then any changes you make will not be saved.