


| Duration | 0:00 | Takeoff Distance | 0 |
| Height: | metres |
| Climb: | m/sec |
| Speed: | km/h |
| Distance: | km |
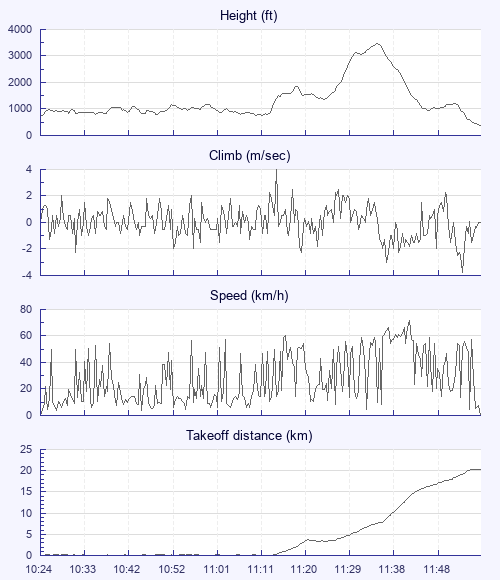
| Height - GPS data | |
| Maximum Height [11:38:06] |
3461 ft |
| Takeoff Height [10:24:24] |
732 ft |
| Landing Height [11:59:24] |
394 ft |
| Total Ascent | 9193 ft |
| Height Gain | |
| Above Takeoff | 2730 ft |
| Units | |
| Climb - Pressure data | |
| Maximum Climb [11:16:24] |
4.0 m/s |
| Minimum Climb [11:56:52] |
-3.8 m/s |
| Units | |
| Speed | |
| Maximum Speed [11:45:12] |
72.0 km/h |
| Average Speed around course |
16.8 km/h |
| Average Speed over track length |
27.9 km/h |
| Units | |
| Tracklog | |
| Flight Duration | 1hr 35mins |
| Track Points | 5701 |
| Recording Interval | 1 secs |
| Statistics Interval | 4 secs |
| Track Length | 44.1 km |
| Units | |
| Flight instrument | |
| Type | Air3 Air3-7.2 8.1.0 |
| Model | Not Set |
| Firmware | 0.9.5.3 |
| Height: | |
| Speed: | |
| Climb: | |
| Distance: |
| Main Map: |
| First Tab: |