


| Duration | 0:00 | Takeoff Distance | 0 |
| Height: | metres |
| Climb: | m/sec |
| Speed: | km/h |
| Distance: | km |
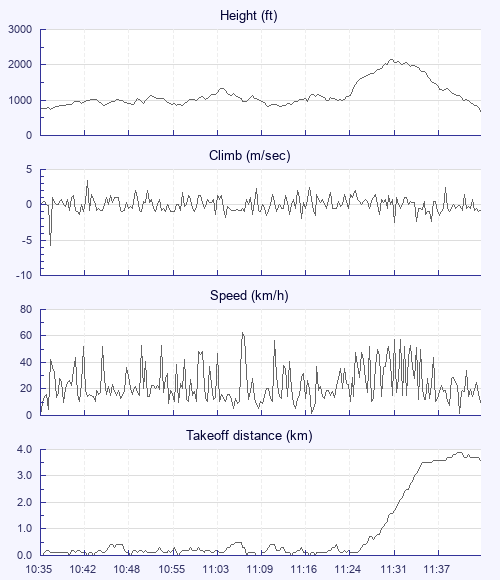
| Height - GPS data | |
| Maximum Height [11:33:01] |
2165 ft |
| Takeoff Height [10:35:33] |
732 ft |
| Landing Height [11:46:53] |
686 ft |
| Total Ascent | 7034 ft |
| Height Gain | |
| Above Takeoff | 1434 ft |
| Units | |
| Climb - Pressure data | |
| Maximum Climb [10:42:49] |
3.5 m/s |
| Minimum Climb [10:36:49] |
-5.8 m/s |
| Units | |
| Speed | |
| Maximum Speed [11:07:49] |
63.0 km/h |
| Average Speed around course |
5.9 km/h |
| Average Speed over track length |
23.6 km/h |
| Units | |
| Tracklog | |
| Flight Duration | 1hr 11mins |
| Track Points | 4281 |
| Recording Interval | 1 secs |
| Statistics Interval | 4 secs |
| Track Length | 28.0 km |
| Units | |
| Flight instrument | |
| Type | Flyskyhy |
| Model | 7.3.1 |
| Firmware | 7.3.1 |
| Height: | |
| Speed: | |
| Climb: | |
| Distance: |
| Main Map: |
| First Tab: |