


| Duration | 0:00 | Takeoff Distance | 0 |
| Height: | metres |
| Climb: | m/sec |
| Speed: | km/h |
| Distance: | km |
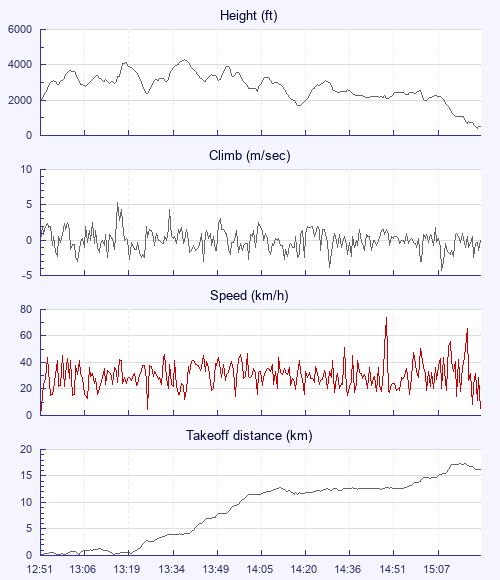
| Height - GPS data | |
| Maximum Height [13:39:14] |
4288 ft |
| Lowest Save [14:19:32] |
1693 ft |
| Takeoff Height [12:51:36] |
2008 ft |
| Landing Height [15:23:21] |
492 ft |
| Total Ascent | 15046 ft |
| Height Gain | |
| Above Takeoff | 2280 ft |
| Maximum | 2290 ft |
| Low Point [12:51:41] |
1998 ft |
| High Point as Maximum Height |
4288 ft |
| Units | |
| Climb - Pressure data | |
| Maximum Climb [13:17:20] |
5.3 m/s |
| Minimum Climb [15:09:58] |
-4.3 m/s |
| Units | |
| Speed | |
| Maximum Speed [14:50:30] |
73.8 km/h |
| Average Speed around course |
10.2 km/h |
| Average Speed over track length |
30.5 km/h |
| Units | |
| Tracklog | |
| Flight Duration | 2hrs 31mins |
| Track Points | 8957 |
| Recording Interval | 1 secs |
| Statistics Interval | 4 secs |
| Track Length | 77.2 km |
| Invalid Positions [< 1%] |
14 |
| Units | |
| Flight instrument | |
| Type | Xc_tracer_ii |
| Model | Not Set |
| Firmware | Xc_tracer_ii_r11 |
| Height: | |
| Speed: | |
| Climb: | |
| Distance: |
| Main Map: |
| First Tab: |