


| Duration | 0:00 | Takeoff Distance | 0 |
| Height: | metres |
| Climb: | m/sec |
| Speed: | km/h |
| Distance: | km |
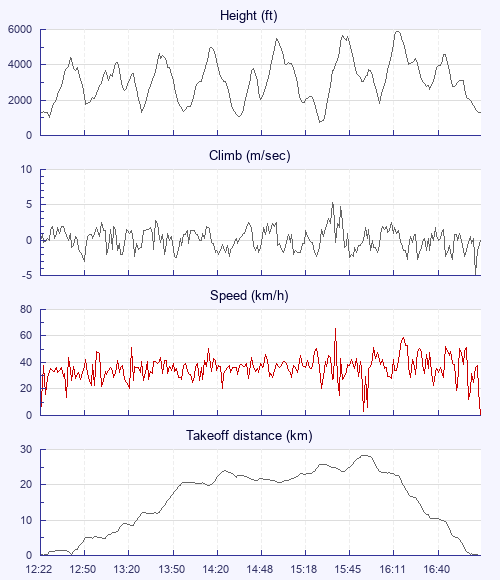
| Height - GPS data | |
| Maximum Height [16:16:20] |
5892 ft |
| Lowest Save [15:30:18] |
761 ft |
| Takeoff Height [12:22:15] |
1375 ft |
| Landing Height [17:09:46] |
1299 ft |
| Total Ascent | 39728 ft |
| Height Gain | |
| Above Takeoff | 4518 ft |
| Maximum | 5131 ft |
| Low Point as Lowest Save |
761 ft |
| High Point as Maximum Height |
5892 ft |
| Units | |
| Climb - Pressure data | |
| Maximum Climb [15:37:48] |
5.3 m/s |
| Minimum Climb [17:07:44] |
-4.8 m/s |
| Units | |
| Speed | |
| Maximum Speed [15:38:32] |
65.7 km/h |
| Average Speed around course |
16.3 km/h |
| Average Speed over track length |
36.0 km/h |
| Units | |
| Tracklog | |
| Flight Duration | 4hrs 47mins |
| Track Points | 17173 |
| Recording Interval | 1 secs |
| Statistics Interval | 4 secs |
| Track Length | 172.7 km |
| Invalid Positions [< 1%] |
2 |
| Units | |
| Flight instrument | |
| Type | Flyskyhy |
| Model | 7.2 |
| Firmware | 7.2 |
| Height: | |
| Speed: | |
| Climb: | |
| Distance: |
| Main Map: |
| First Tab: |