


| Duration | 0:00 | Takeoff Distance | 0 |
| Height: | metres |
| Climb: | m/sec |
| Speed: | km/h |
| Distance: | km |
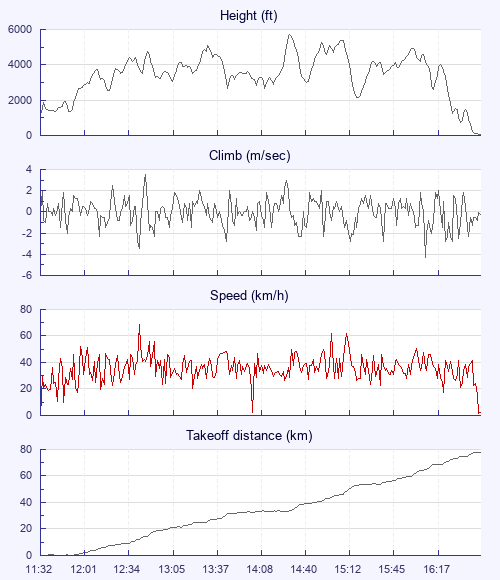
| Height - GPS data | |
| Maximum Height [14:32:15] |
5702 ft |
| Lowest Save [16:38:19] |
719 ft |
| Takeoff Height [11:32:32] |
1178 ft |
| Landing Height [16:48:20] |
69 ft |
| Total Ascent | 38058 ft |
| Height Gain | |
| Above Takeoff | 4524 ft |
| Maximum | 4528 ft |
| Low Point [11:32:33] |
1175 ft |
| High Point as Maximum Height |
5702 ft |
| Units | |
| Climb - Pressure data | |
| Maximum Climb [12:46:23] |
3.5 m/s |
| Minimum Climb [16:13:09] |
-4.3 m/s |
| Units | |
| Speed | |
| Maximum Speed [12:42:43] |
68.4 km/h |
| Average Speed around course |
15.6 km/h |
| Average Speed over track length |
35.8 km/h |
| Units | |
| Tracklog | |
| Flight Duration | 5hrs 15mins |
| Track Points | 18891 |
| Recording Interval | 1 secs |
| Statistics Interval | 4 secs |
| Track Length | 188.5 km |
| Invalid Positions [< 1%] |
7 |
| Units | |
| Flight instrument | |
| Type | Flyskyhy |
| Model | 7.1.1 |
| Firmware | 7.1.1 |
| Height: | |
| Speed: | |
| Climb: | |
| Distance: |
| Main Map: |
| First Tab: |