


| Duration | 0:00 | Takeoff Distance | 0 |
| Height: | metres |
| Climb: | m/sec |
| Speed: | km/h |
| Distance: | km |
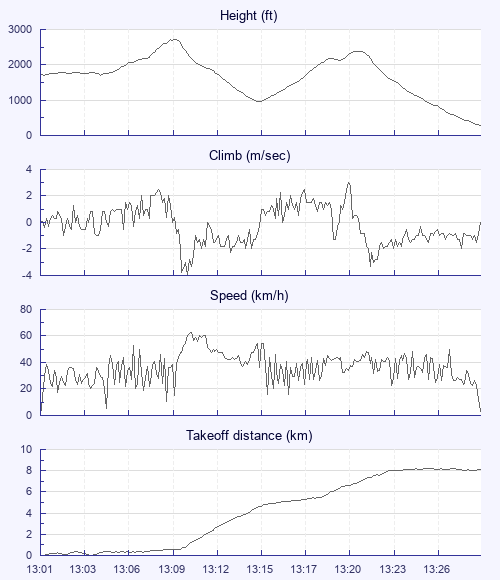
| Height - GPS data | |
| Maximum Height [13:09:45] |
2713 ft |
| Lowest Save [13:15:31] |
958 ft |
| Takeoff Height [13:01:09] |
1716 ft |
| Landing Height [13:30:02] |
295 ft |
| Total Ascent | 2959 ft |
| Height Gain | |
| Above Takeoff | 997 ft |
| Maximum | 1430 ft |
| Low Point as Lowest Save |
958 ft |
| High Point [13:22:11] |
2388 ft |
| Units | |
| Climb - Pressure data | |
| Maximum Climb [13:21:30] |
3.0 m/s |
| Minimum Climb [13:10:38] |
-4.0 m/s |
| Units | |
| Speed | |
| Maximum Speed [13:10:54] |
63.0 km/h |
| Average Speed around course |
23.7 km/h |
| Average Speed over track length |
37.0 km/h |
| Units | |
| Tracklog | |
| Flight Duration | 28mins |
| Track Points | 1725 |
| Recording Interval | 1 secs |
| Statistics Interval | 4 secs |
| Track Length | 17.8 km |
| Units | |
| Flight instrument - reported as | |
| Flymaster F1, V1.21, S/N 1229 |
| Height: | |
| Speed: | |
| Climb: | |
| Distance: |
| Main Map: |
| First Tab: |