


| Duration | 0:00 | Takeoff Distance | 0 |
| Height: | metres |
| Climb: | m/sec |
| Speed: | km/h |
| Distance: | km |
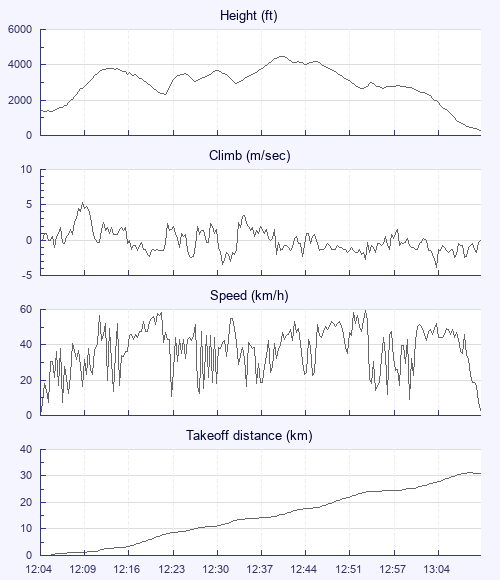
| Height - GPS data | |
| Maximum Height [12:42:21] |
4478 ft |
| Lowest Save [12:23:13] |
2333 ft |
| Takeoff Height [12:04:07] |
1388 ft |
| Landing Height [13:12:25] |
292 ft |
| Total Ascent | 7106 ft |
| Height Gain | |
| Above Takeoff | 3091 ft |
| Maximum | 3114 ft |
| Low Point [12:04:45] |
1365 ft |
| High Point as Maximum Height |
4478 ft |
| Units | |
| Climb - Pressure data | |
| Maximum Climb [12:09:37] |
5.3 m/s |
| Minimum Climb [13:06:17] |
-3.8 m/s |
| Units | |
| Speed | |
| Maximum Speed [12:55:45] |
59.4 km/h |
| Average Speed around course |
29.4 km/h |
| Average Speed over track length |
38.3 km/h |
| Units | |
| Tracklog | |
| Flight Duration | 1hr 8mins |
| Track Points | 1039 |
| Recording Interval | 4 secs |
| Statistics Interval | 4 secs |
| Track Length | 43.6 km |
| Units | |
| Flight instrument | |
| Type | Oudie 5 Pro |
| Model | R |
| Firmware | 9.31.001 |
| Height: | |
| Speed: | |
| Climb: | |
| Distance: |
| Main Map: |
| First Tab: |