


| Duration | 0:00 | Takeoff Distance | 0 |
| Height: | metres |
| Climb: | m/sec |
| Speed: | km/h |
| Distance: | km |
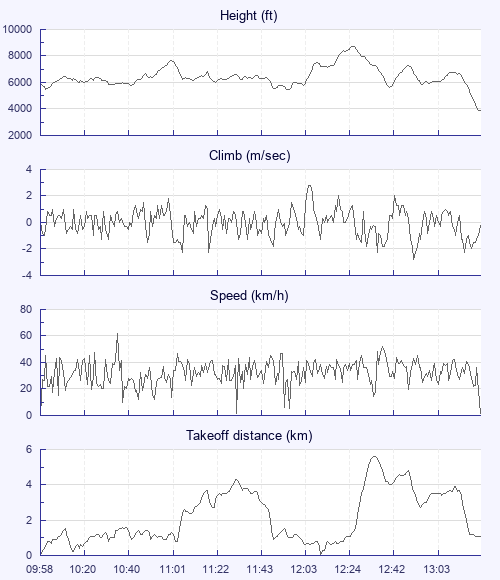
| Height - GPS data | |
| Maximum Height [12:26:48] |
8727 ft |
| Lowest Save [11:56:46] |
5456 ft |
| Takeoff Height [09:58:35] |
5889 ft |
| Landing Height [13:24:58] |
3894 ft |
| Total Ascent | 19610 ft |
| Height Gain | |
| Above Takeoff | 2838 ft |
| Maximum | 3271 ft |
| Low Point as Lowest Save |
5456 ft |
| High Point as Maximum Height |
8727 ft |
| Units | |
| Climb - Pressure data | |
| Maximum Climb [12:05:37] |
2.8 m/s |
| Minimum Climb [12:53:34] |
-2.8 m/s |
| Units | |
| Speed | |
| Maximum Speed [10:36:40] |
62.1 km/h |
| Average Speed around course |
10.7 km/h |
| Average Speed over track length |
33.3 km/h |
| Units | |
| Tracklog | |
| Flight Duration | 3hrs 26mins |
| Track Points | 12366 |
| Recording Interval | 1 secs |
| Statistics Interval | 4 secs |
| Track Length | 114.4 km |
| Units | |
| Flight instrument | |
| Type | Flyskyhy |
| Model | 6.16.0 |
| Firmware | 6.16.0 |
| Height: | |
| Speed: | |
| Climb: | |
| Distance: |
| Main Map: |
| First Tab: |