


| Duration | 0:00 | Takeoff Distance | 0 |
| Height: | metres |
| Climb: | m/sec |
| Speed: | km/h |
| Distance: | km |
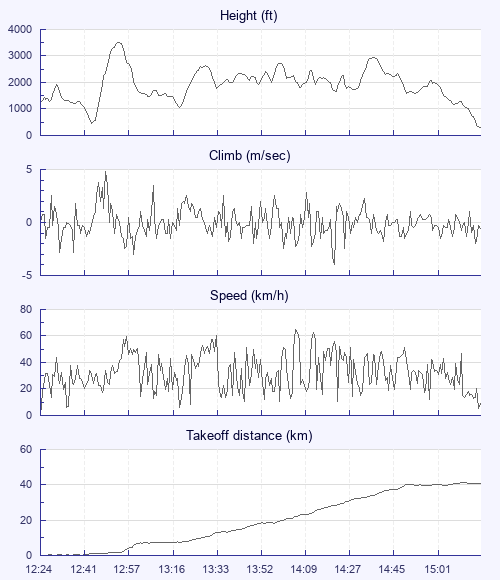
| Height - GPS data | |
| Maximum Height [12:54:11] |
3520 ft |
| Lowest Save [13:18:36] |
1063 ft |
| Takeoff Height [12:24:53] |
1263 ft |
| Landing Height [15:18:39] |
308 ft |
| Total Ascent | 19255 ft |
| Height Gain | |
| Above Takeoff | 2257 ft |
| Maximum | 3061 ft |
| Low Point [12:44:38] |
459 ft |
| High Point as Maximum Height |
3520 ft |
| Units | |
| Climb - Pressure data | |
| Maximum Climb [12:49:13] |
4.8 m/s |
| Minimum Climb [14:21:33] |
-4.0 m/s |
| Units | |
| Speed | |
| Maximum Speed [14:06:45] |
64.8 km/h |
| Average Speed around course |
18.3 km/h |
| Average Speed over track length |
32.6 km/h |
| Units | |
| Tracklog | |
| Flight Duration | 2hrs 53mins |
| Track Points | 10427 |
| Recording Interval | 1 secs |
| Statistics Interval | 4 secs |
| Track Length | 94.4 km |
| Units | |
| Flight instrument | |
| Type | Xiaomi Mi Mix 2 8.0.0 |
| Model | Not Set |
| Firmware | 0.8.2 |
| Height: | |
| Speed: | |
| Climb: | |
| Distance: |
| Main Map: |
| First Tab: |