


| Duration | 0:00 | Takeoff Distance | 0 |
| Height: | metres |
| Climb: | m/sec |
| Speed: | km/h |
| Distance: | km |
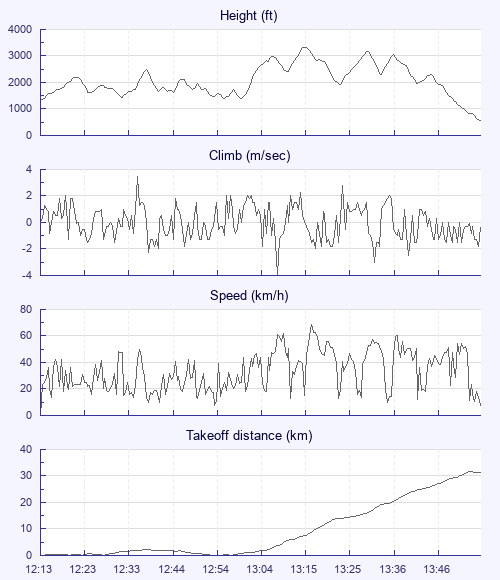
| Height - GPS data | |
| Maximum Height [13:15:09] |
3337 ft |
| Lowest Save [12:57:00] |
1385 ft |
| Takeoff Height [12:13:24] |
1348 ft |
| Landing Height [13:56:59] |
561 ft |
| Total Ascent | 10098 ft |
| Height Gain | |
| Above Takeoff | 1988 ft |
| Maximum | 1991 ft |
| Low Point [12:13:45] |
1345 ft |
| High Point as Maximum Height |
3337 ft |
| Units | |
| Climb - Pressure data | |
| Maximum Climb [12:35:48] |
3.5 m/s |
| Minimum Climb [13:09:08] |
-4.0 m/s |
| Units | |
| Speed | |
| Maximum Speed [13:16:52] |
68.4 km/h |
| Average Speed around course |
24.3 km/h |
| Average Speed over track length |
33.7 km/h |
| Units | |
| Tracklog | |
| Flight Duration | 1hr 43mins |
| Track Points | 6216 |
| Recording Interval | 1 secs |
| Statistics Interval | 4 secs |
| Track Length | 58.2 km |
| Units | |
| Flight instrument - reported as | |
| SKYTRAXX V1.87 SN:4028419520 |
| Height: | |
| Speed: | |
| Climb: | |
| Distance: |
| Main Map: |
| First Tab: |