


| Duration | 0:00 | Takeoff Distance | 0 |
| Height: | metres |
| Climb: | m/sec |
| Speed: | km/h |
| Distance: | km |
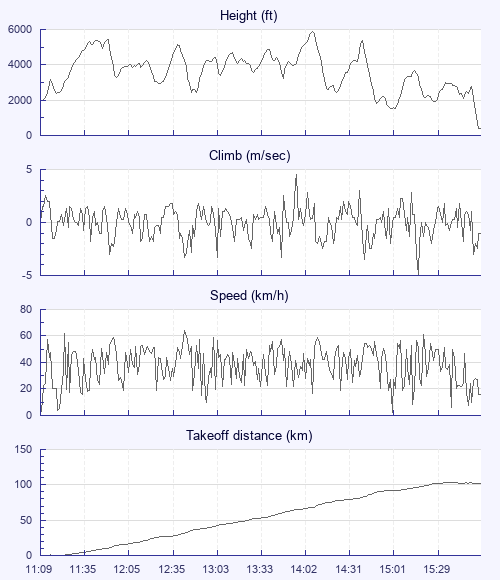
| Height - GPS data | |
| Maximum Height [14:10:22] |
5886 ft |
| Lowest Save [15:04:01] |
1512 ft |
| Takeoff Height [11:09:56] |
1952 ft |
| Landing Height [15:59:03] |
407 ft |
| Total Ascent | 31572 ft |
| Height Gain | |
| Above Takeoff | 3934 ft |
| Maximum | 3944 ft |
| Low Point [11:10:05] |
1942 ft |
| High Point as Maximum Height |
5886 ft |
| Units | |
| Climb - Pressure data | |
| Maximum Climb [14:00:24] |
4.5 m/s |
| Minimum Climb [15:21:04] |
-5.0 m/s |
| Units | |
| Speed | |
| Maximum Speed [12:44:12] |
63.9 km/h |
| Average Speed around course |
22.9 km/h |
| Average Speed over track length |
38.7 km/h |
| Units | |
| Tracklog | |
| Flight Duration | 4hrs 49mins |
| Track Points | 17348 |
| Recording Interval | 1 secs |
| Statistics Interval | 4 secs |
| Track Length | 186.6 km |
| Units | |
| Flight instrument | |
| Type | Htc Htc U11 8.0.0 |
| Model | Not Set |
| Firmware | 0.8.2-beta |
| Height: | |
| Speed: | |
| Climb: | |
| Distance: |
| Main Map: |
| First Tab: |