


| Duration | 0:00 | Takeoff Distance | 0 |
| Height: | metres |
| Climb: | m/sec |
| Speed: | km/h |
| Distance: | km |
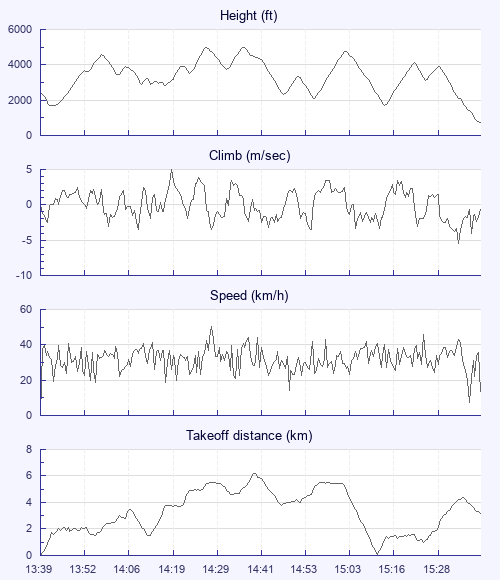
| Height - GPS data | |
| Maximum Height [14:37:02] |
5007 ft |
| Lowest Save [13:43:26] |
1677 ft |
| Takeoff Height [13:39:35] |
2425 ft |
| Landing Height [15:37:05] |
732 ft |
| Total Ascent | 15381 ft |
| Height Gain | |
| Above Takeoff | 2582 ft |
| Maximum | 3330 ft |
| Low Point as Lowest Save |
1677 ft |
| High Point as Maximum Height |
5007 ft |
| Units | |
| Climb - GPS data | |
| Maximum Climb [14:19:14] |
5.0 m/s |
| Minimum Climb [15:32:04] |
-5.5 m/s |
| Units | |
| Speed | |
| Maximum Speed [14:28:39] |
50.4 km/h |
| Average Speed around course |
15.4 km/h |
| Average Speed over track length |
31.9 km/h |
| Units | |
| Tracklog | |
| Flight Duration | 1hr 57mins |
| Track Points | 2722 |
| Recording Interval | 3 secs |
| Statistics Interval | 6 secs |
| Track Length | 62.4 km |
| Units | |
| Flight instrument - reported as | |
| Garmin USB: GPSMap76CSX Software Version 4.00 |
| Height: | |
| Speed: | |
| Climb: | |
| Distance: |
| Main Map: |
| First Tab: |