


| Duration | 0:00 | Takeoff Distance | 0 |
| Height: | metres |
| Climb: | m/sec |
| Speed: | km/h |
| Distance: | km |
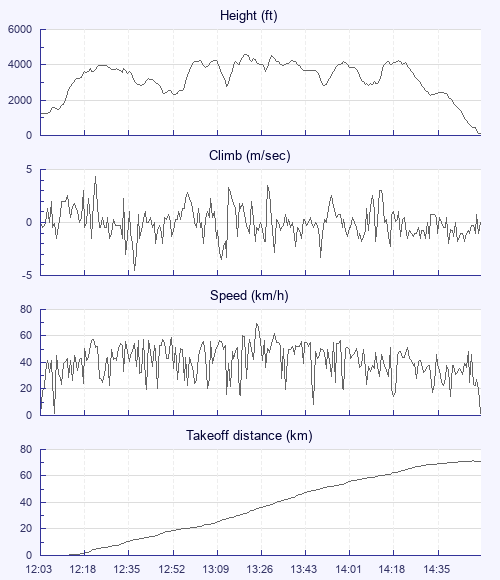
| Height - GPS data | |
| Maximum Height [13:23:05] |
4610 ft |
| Lowest Save [12:54:14] |
2313 ft |
| Takeoff Height [12:03:09] |
1194 ft |
| Landing Height [14:55:32] |
89 ft |
| Total Ascent | 17356 ft |
| Height Gain | |
| Above Takeoff | 3415 ft |
| Units | |
| Climb - Pressure data | |
| Maximum Climb [12:23:05] |
4.3 m/s |
| Minimum Climb [12:38:53] |
-4.5 m/s |
| Units | |
| Speed | |
| Maximum Speed [13:28:05] |
69.3 km/h |
| Average Speed around course |
28.9 km/h |
| Average Speed over track length |
41.0 km/h |
| Units | |
| Tracklog | |
| Flight Duration | 2hrs 52mins |
| Track Points | 10344 |
| Recording Interval | 1 secs |
| Statistics Interval | 4 secs |
| Track Length | 117.7 km |
| Units | |
| Flight instrument | |
| Type | Xc_tracer_ii |
| Model | Not Set |
| Firmware | Xc_tracer_ii_r03 |
| Height: | |
| Speed: | |
| Climb: | |
| Distance: |
| Main Map: |
| First Tab: |