


| Duration | 0:00 | Takeoff Distance | 0 |
| Height: | metres |
| Climb: | m/sec |
| Speed: | km/h |
| Distance: | km |
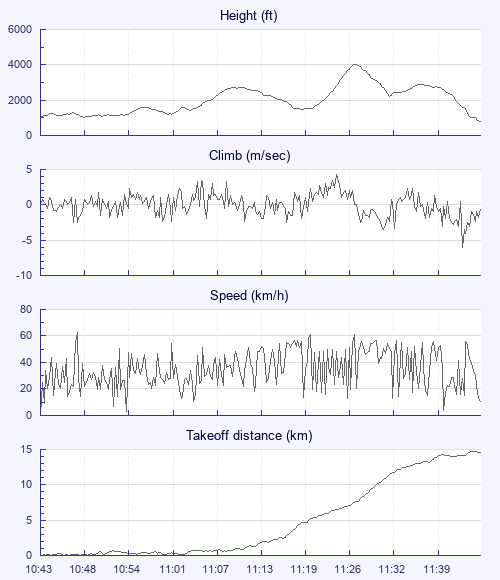
| Height - GPS data | |
| Maximum Height [11:27:33] |
4032 ft |
| Lowest Save [11:19:55] |
1483 ft |
| Takeoff Height [10:43:00] |
1050 ft |
| Landing Height [11:44:48] |
771 ft |
| Total Ascent | 7142 ft |
| Height Gain | |
| Above Takeoff | 2982 ft |
| Maximum | 2995 ft |
| Low Point [10:48:52] |
1037 ft |
| High Point as Maximum Height |
4032 ft |
| Units | |
| Climb - Pressure data | |
| Maximum Climb [11:24:45] |
4.3 m/s |
| Minimum Climb [11:42:51] |
-6.0 m/s |
| Units | |
| Speed | |
| Maximum Speed [10:48:00] |
63.0 km/h |
| Average Speed around course |
17.8 km/h |
| Average Speed over track length |
35.8 km/h |
| Units | |
| Tracklog | |
| Flight Duration | 1hr 1min |
| Track Points | 3648 |
| Recording Interval | 1 secs |
| Statistics Interval | 4 secs |
| Track Length | 36.9 km |
| Units | |
| Flight instrument | |
| Type | Skybean |
| Model | Skydrop |
| Firmware | Build 3850 |
| Height: | |
| Speed: | |
| Climb: | |
| Distance: |
| Main Map: |
| First Tab: |