


| Duration | 0:00 | Takeoff Distance | 0 |
| Height: | metres |
| Climb: | m/sec |
| Speed: | km/h |
| Distance: | km |
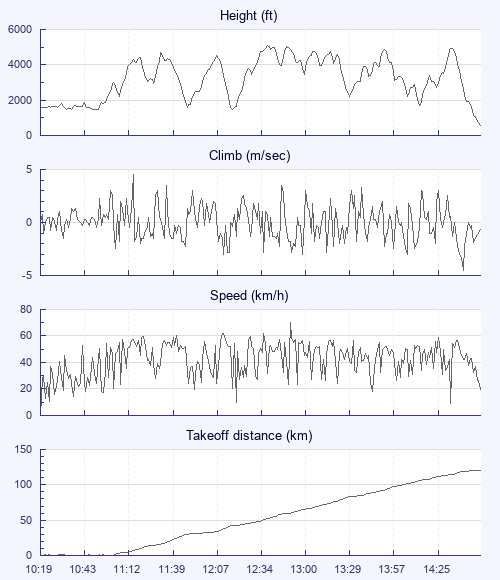
| Height - GPS data | |
| Maximum Height [12:40:02] |
5118 ft |
| Lowest Save [12:18:27] |
1496 ft |
| Takeoff Height [10:19:57] |
1568 ft |
| Landing Height [14:51:39] |
548 ft |
| Total Ascent | 34042 ft |
| Height Gain | |
| Above Takeoff | 3550 ft |
| Maximum | 3691 ft |
| Low Point [10:52:21] |
1427 ft |
| High Point as Maximum Height |
5118 ft |
| Units | |
| Climb - Pressure data | |
| Maximum Climb [11:14:49] |
4.5 m/s |
| Minimum Climb [14:43:29] |
-4.5 m/s |
| Units | |
| Speed | |
| Maximum Speed [12:53:45] |
70.2 km/h |
| Average Speed around course |
28.5 km/h |
| Average Speed over track length |
42.1 km/h |
| Units | |
| Tracklog | |
| Flight Duration | 4hrs 31mins |
| Track Points | 16303 |
| Recording Interval | 1 secs |
| Statistics Interval | 4 secs |
| Track Length | 190.5 km |
| Units | |
| Flight instrument - reported as | |
| Flymaster F1, V1.7, S/N 403 |
| Height: | |
| Speed: | |
| Climb: | |
| Distance: |
| Main Map: |
| First Tab: |