


| Duration | 0:00 | Takeoff Distance | 0 |
| Height: | metres |
| Climb: | m/sec |
| Speed: | km/h |
| Distance: | km |
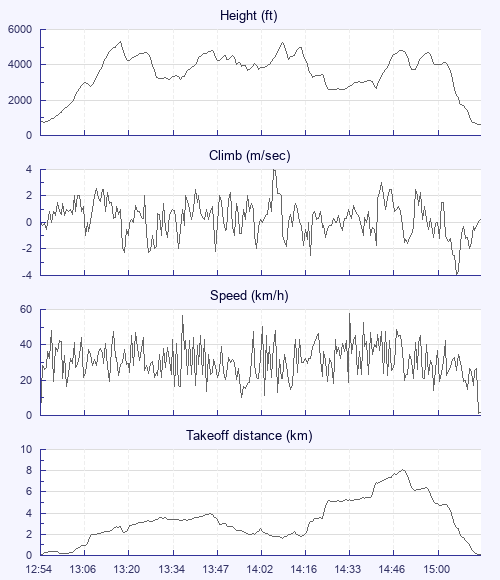
| Height - GPS data | |
| Maximum Height [13:17:58] |
5305 ft |
| Lowest Save [14:34:01] |
2605 ft |
| Takeoff Height [12:54:43] |
791 ft |
| Landing Height [15:20:20] |
643 ft |
| Total Ascent | 15778 ft |
| Height Gain | |
| Above Takeoff | 4514 ft |
| Maximum | 4547 ft |
| Low Point [12:56:01] |
758 ft |
| High Point as Maximum Height |
5305 ft |
| Units | |
| Climb - GPS data | |
| Maximum Climb [14:08:28] |
4.0 m/s |
| Minimum Climb [15:11:39] |
-4.0 m/s |
| Units | |
| Speed | |
| Maximum Speed [14:35:16] |
57.6 km/h |
| Average Speed around course |
10.0 km/h |
| Average Speed over track length |
30.3 km/h |
| Units | |
| Tracklog | |
| Flight Duration | 2hrs 25mins |
| Track Points | 1571 |
| Recording Interval | 6 secs |
| Statistics Interval | 6 secs |
| Track Length | 73.5 km |
| Units | |
| Flight instrument - reported as | |
| GPSMap76CSX Software Version 3.50 |
| Height: | |
| Speed: | |
| Climb: | |
| Distance: |
| Main Map: |
| First Tab: |